If you have to periodically cleanse and validate valuation data within a specific time window, and keep an audit trail of your validation workflow, you can use Xplain’s anomaly detection module for valuation data.
You can also use our market data anomaly detection module or our trade onboarding module, which are based on a similar methodology.
We will use the term VD XM or valuation data XM when referring to valuation data cleansing.
On this page, we will set out:
- how to start a valuation data XM workflow by creating a dashboard
- the key steps of the workflow and how to monitor its progress via the dashboard
- how to re-run a (selection of) stream(s) from the current clearing phase
You can view and export the results of the data cleansing process “as-you-go”, including Overlay I or Overlay II cleansed data (as described in the key steps of the workflow) and corresponding valuation data sources.
The Prerequisites
In terms of generic prerequisites, you can refer to or use the predefined break tests and task allocation settings, as described in the sandbox environment.
Completed Dashboard Example
You can view a completed dashboard that was run for the ‘LDN 1500’ and ‘LDN 1600’ pricing slots in respect of all the portfolios belonging to the ‘BLUESTONE’ company, or one that was run for the ‘LDN COB’ pricing slot in respect of the ‘LONDON_FICC/RATES_DESK/IRS_PTF_1’ portfolio. Alternatively, you can replicate the completed ‘LDN COB’ dashboard by starting your own VD XM workflow.
This page will guide you through the process using an example: running the anomaly detection process as at 30 November 2022 for the ‘LDN COB’ pricing slot (linked to ‘NEW VALUATION DATA GROUP’) in respect of ‘NEWPORTFOLIO’.
One of the example break tests used is a day-on-day Overlay I test, which compares current data to the previous dashboard’s data to spot anomalies. In theory, you should run a dashboard as at 29 November 2022 before running one as at 30 November 2022 to be able to compare the two sets of valuations however, in our worked example, the focus will be on the other example break test, which is a source-to-source Overlay II test for the current date, so we will not need to do so.
Starting a Valuation Data XM Workflow
Once you have met the generic prerequisites and have a valuation data environment ready, you can start a valuation data XM workflow by creating a dashboard.
You can then monitor the key steps of its progress at the dashboard level.
At any point of the VD XM workflow, at the dashboard level, you can re-run a (selection of) stream(s) from the current clearing phase.
You can view and export the results of the data cleansing process “as-you-go”, including Overlay I or Overlay II cleansed data (as described in the key steps of the workflow) and corresponding valuation data sources.
| Field Name | Description | Permissible Values |
|---|---|---|
| Pricing Slots | A list of in-scope pricing slots | Any existing Pricing Slot |
| Portfolios | A list of companies / entities / portfolios |
Any existing Company ID / Entity ID / Portfolio ID See company configuration |
| Valuation Date | The valuation date (set by default to the system's anchor date) | YYYY-MM-DD (ISO 8601) |
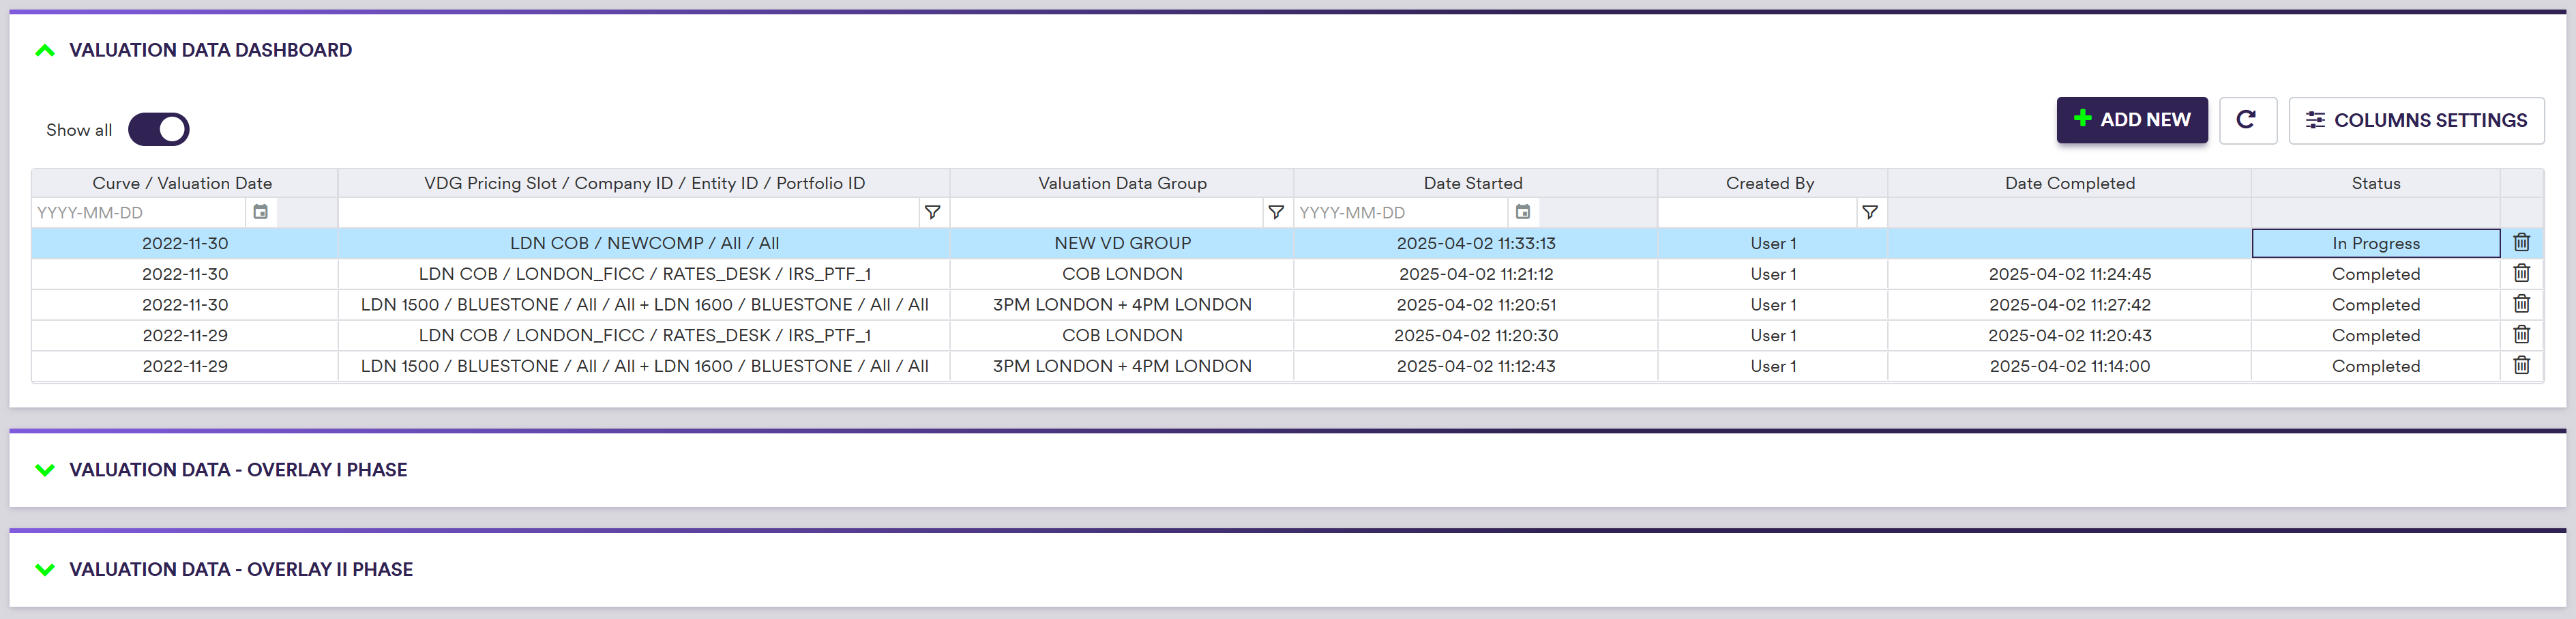
Data Cleansing/Valuation Data/Valuation Data XM Dashboard
You can now start the VD XM workflow by clicking on
After clicking on
Data Cleansing/Valuation Data
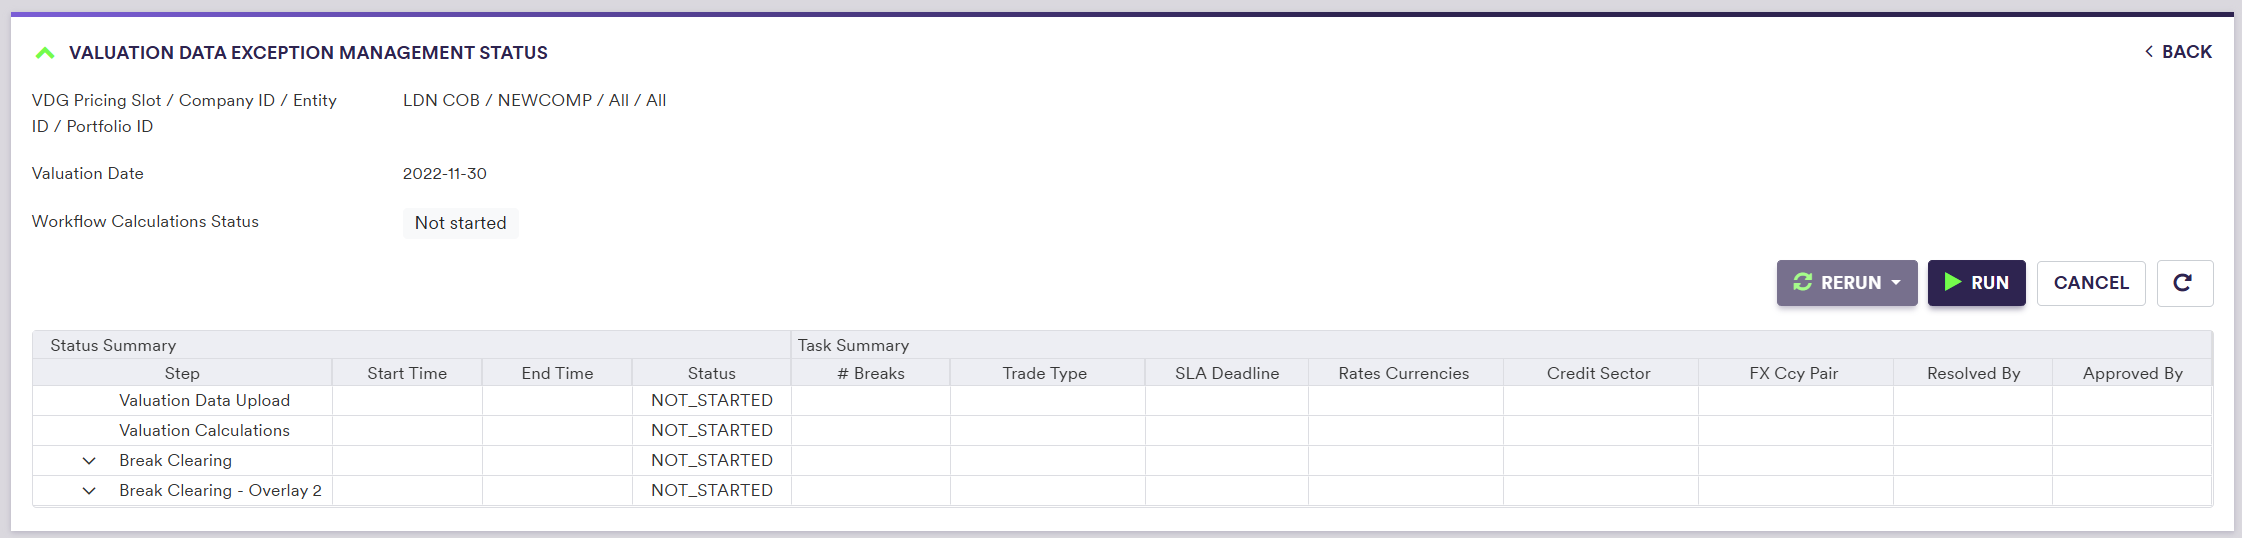
Under
- from ‘Not Started’, after clicking on
Create - to ‘In Progress’, after clicking on
Run - to ‘Completed’, once all break test phases have been completed (i.e. any actual breaks identified during break testing were successfully resolved and approved)
%%{init:{
  'flowchart':{
    'nodeSpacing': 50,
    'rankSpacing': 50,
    'diagramPadding': 5
  }
}}%%
flowchart TB

A["Not Started"]
B["In Progress"]
C["Completed"]

subgraph title[Dashboard Status]
A --> B
B --> C
end

classDef subgraphStyle font-weight:bold,fill:none,stroke:#805CDD,stroke-width:1px;
classDef xplStyle fill:#805CDD,stroke:#333,stroke-width:1px,color:#fff;

class title subgraphStyle;
class A,B,C xplStyle;
You can monitor the progress of the VD XM workflow in a more granular way at the dashboard level, as described in the section below.
Key Steps of the Valuation Data XM Workflow
Under
In this section, we will discuss:
- how break tests are applied on valuation data
- the break test phases that may require your resolution and approval input (if there are any actual breaks)
The four main phases of the VD XM workflow which can be viewed in the dashboard are:
- The ‘Valuation Data Upload’ phase
- The ‘Valuation Calculations’ phase (*)
- The ‘Overlay I Breaks’ phase
- The ‘Overlay II Breaks’ phase (**)
(*) The Valuation Calculations phase will only be performed if Xplain is one of the valuation data providers.
(**) Only relevant when Overlay II break tests are applicable. In that case, the ‘primary provider’ data will be deemed to be the Overlay I outputs.
After loading the relevant valuation data, Xplain will perform break testing for the Overlay I and Overlay II break test phases, as described in the Valuation Data XM Break Testing section below. Any actual break will trigger a break clearing task (resolution and approval).
Each break test phase will be split into streams, as described in the Break Test Phase Streams section below. The resolution and approval of the breaks can then be done in parallel on a stream basis.
For more detail on Overlay I and Overlay II break tests for valuation data, please refer to the break test definitions page.
Data Cleansing/Valuation Data/Valuation Data Dashboard

The overall status of each break test phase are as follows:
%%{init:{
  'flowchart':{
    'nodeSpacing': 50,
    'rankSpacing': 50,
    'diagramPadding': 5
  }
}}%%
flowchart TB

A["Not Started"]
B["In Progress"]
C["Completed"]

subgraph title[Break Test Phase Status]
A --> B
B --> C
end

classDef subgraphStyle font-weight:bold,fill:none,stroke:#805CDD,stroke-width:1px;
classDef xplStyle fill:#805CDD,stroke:#333,stroke-width:1px,color:#fff;

class title subgraphStyle;
class A,B,C xplStyle;
The status of a break test phase will be a function of the status of its streams, which will evolve as described in the Break Test Phase Streams section below. It will be set to ‘Not Started’ if all its streams are either ‘Processing’ or ‘Pending Resolution’, to ‘In Progress’ if at least one of its streams is beyond ‘Pending Resolution’, and to ‘Completed’ if all its streams are ‘Approved’.
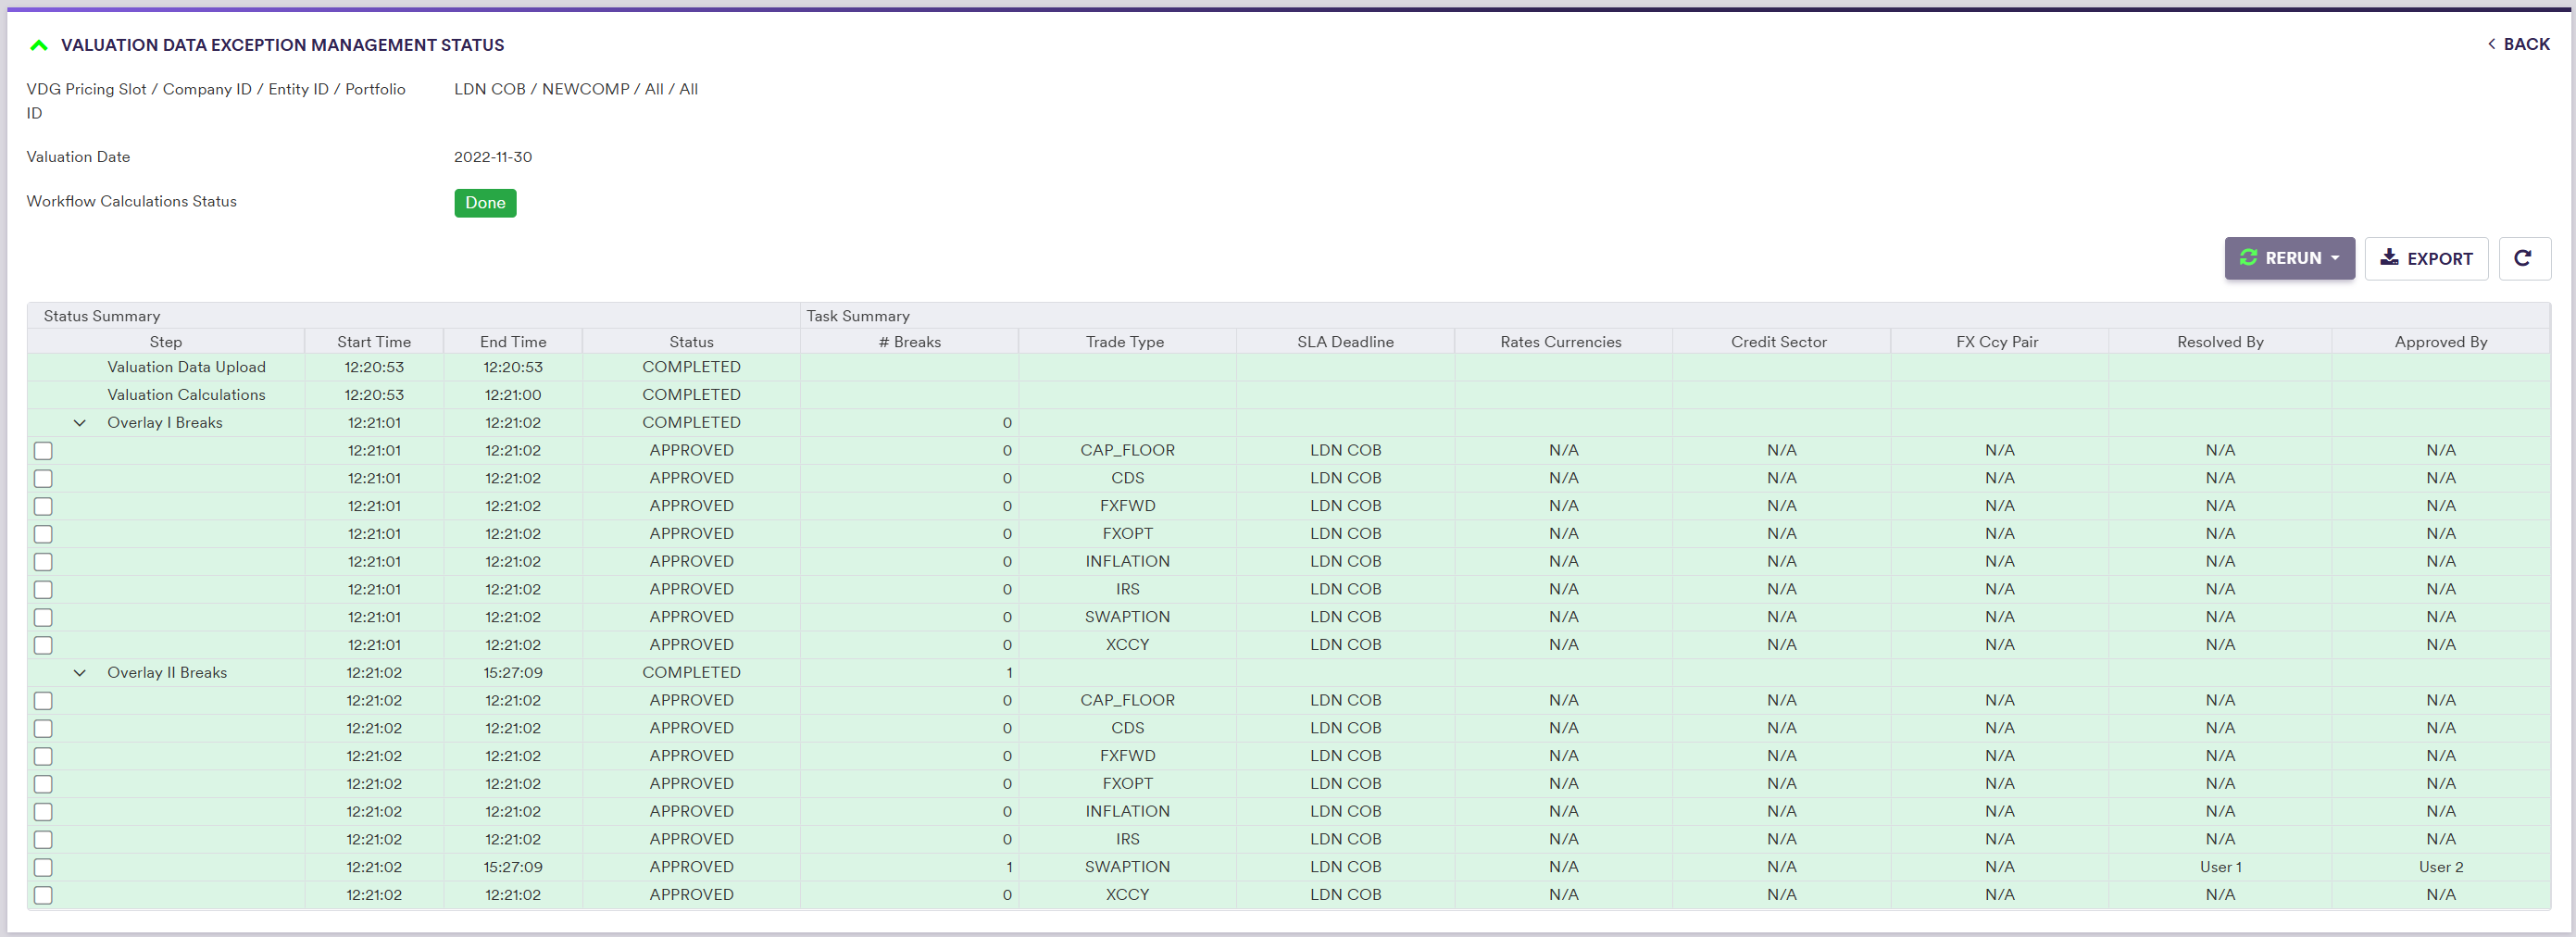
On a trade basis, once all breaks have been resolved and approved (i.e. status is ‘Verified’), you can view the corresponding VD XM results at the dashboard level.
1. Valuation Data XM Break Testing
For each trade, Xplain automatically generates a unique identifier, referred to as a valuation data key (VDK). VDKs are used to map valuation data to the relevant trade when performing valuation data anomaly detection.
Relevant valuation data are determined by the primary to quaternary valuation data providers associated to a trade type, as described in the valuation data provider settings page, or to a given trade in case there is an override, as described in the Valuation Data Provider Mapping Rules page.
Overlay break tests are applied on an VDK basis. Break tests calculations are performed for each [VDK + valuation data provider] combination. For example, when identifying missing data, if a trade type (or a trade, in case there is an override) is linked to three valuation data providers, the ‘NULL’ test (which you cannot disabled) will be applied three times. However, unlike preliminary break tests for market data, only breaks in respect of the primary data provider will require your resolution. Break test calculations in respect of other data providers will just be reported in the same line item.
The output resulting from an Overlay I break resolution is deemed to be the Overlay I Cleansed Data.
Overlay II break tests are applied on an VDK basis, based on the Overlay I Cleansed Data (i.e. equivalent to the primary provider data for Overlay I break tests).
The effective number of successfully applied tests will be reported in the dashboard, but tests that cannot be performed if an underlying data is missing (e.g. a ‘NULL’ value or no previous data available for a day-on-day test) will not trigger a break.
You will need to resolve any actual breaks within a given stream, as described in the Break Test Phase Streams section below.
For day-on-day tests, the ‘previous day’ will be defined as the latest date prior to the current date on which a VD XM dashboard was run and completed for the pricing slot and portfolio(s) in scope. As such, when a VD XM dashboard is run for the first time, day-on-day tests will not be performed.
2. Break Test Phase Streams
Following break testing (Overlay I and Overlay II), you will need to resolve any actual breaks in respect of the primary provider data within a given stream. Streams are defined according to the task granularity settings, with the ‘Overlay I Breaks’ and ‘Overlay II Breaks’ phases split by pricing slot first.
On the Break Test - Valuation Data Resolver page, we will start guiding you through the break test resolution process for valuation data.
More specifically, you can refer directly to the following pages for more detail on:
For each stream with breaks, a resolution task will be generated, that can be checked out then under
Once checked out, the status of the resolution task will go from ‘Pending Resolution’ to ‘In Resolution’. Following the first submission of a proposed resolution (as described in the Valuation Data Break Clearing - Resolver page), an approval task will be generated, that can also be checked out then. Likewise, once checked out, the status of the approval task will go from ‘Pending Approval’ to ‘In Approval’.
If the resolution is rejected (as described in the Valuation Data Break Clearing - Approver page), if no longer live, the resolution task will be visible again with the status ‘In Resolution’, and will need to be re-opened by the original resolver.
Likewise, if no longer live, the approval task will be visible again with the status ‘In Approval’, and will need to be re-opened by the original approver.
While there is no live approval task, the initial status of the stream will be ‘Pending Resolution’, and it will evolve as described in the diagram below. As we allow for partial break clearing, breaks within a stream may be at a different stage of the clearing process. For instance, some items may already be waiting for approval where some others may still be waiting for resolution, in which case the status of the stream will be set to ‘Hybrid’ (i.e. there is both a live resolution task and a live approval task).
%%{init:{
  'flowchart':{
    'nodeSpacing': 50,
    'rankSpacing': 50,
    'diagramPadding': 5
  }
}}%%
flowchart TB

A["Pending Resolution"]
B["In Resolution"]
C["Hybrid"]
D["Pending Approval"]
E["In Approval"]
F["Completed"]

subgraph title["Stream Status"]
A --> B
B --> D
D --> E
E --> F
B <--> C
C <--> E
E <--> B
end

classDef subgraphStyle font-weight:bold,fill:none,stroke:#805CDD,stroke-width:1px;
classDef xplStyle fill:#805CDD,stroke:#333,stroke-width:1px,color:#fff;

class title subgraphStyle;
class A,B,C,D,E,F xplStyle;
When expanded, the information related to a break test phase will set out the status of each stream.
At any point of the VD XM workflow, at the dashboard level, you will have the option to select and re-run selected streams (in its entirety or updated valuation data only).
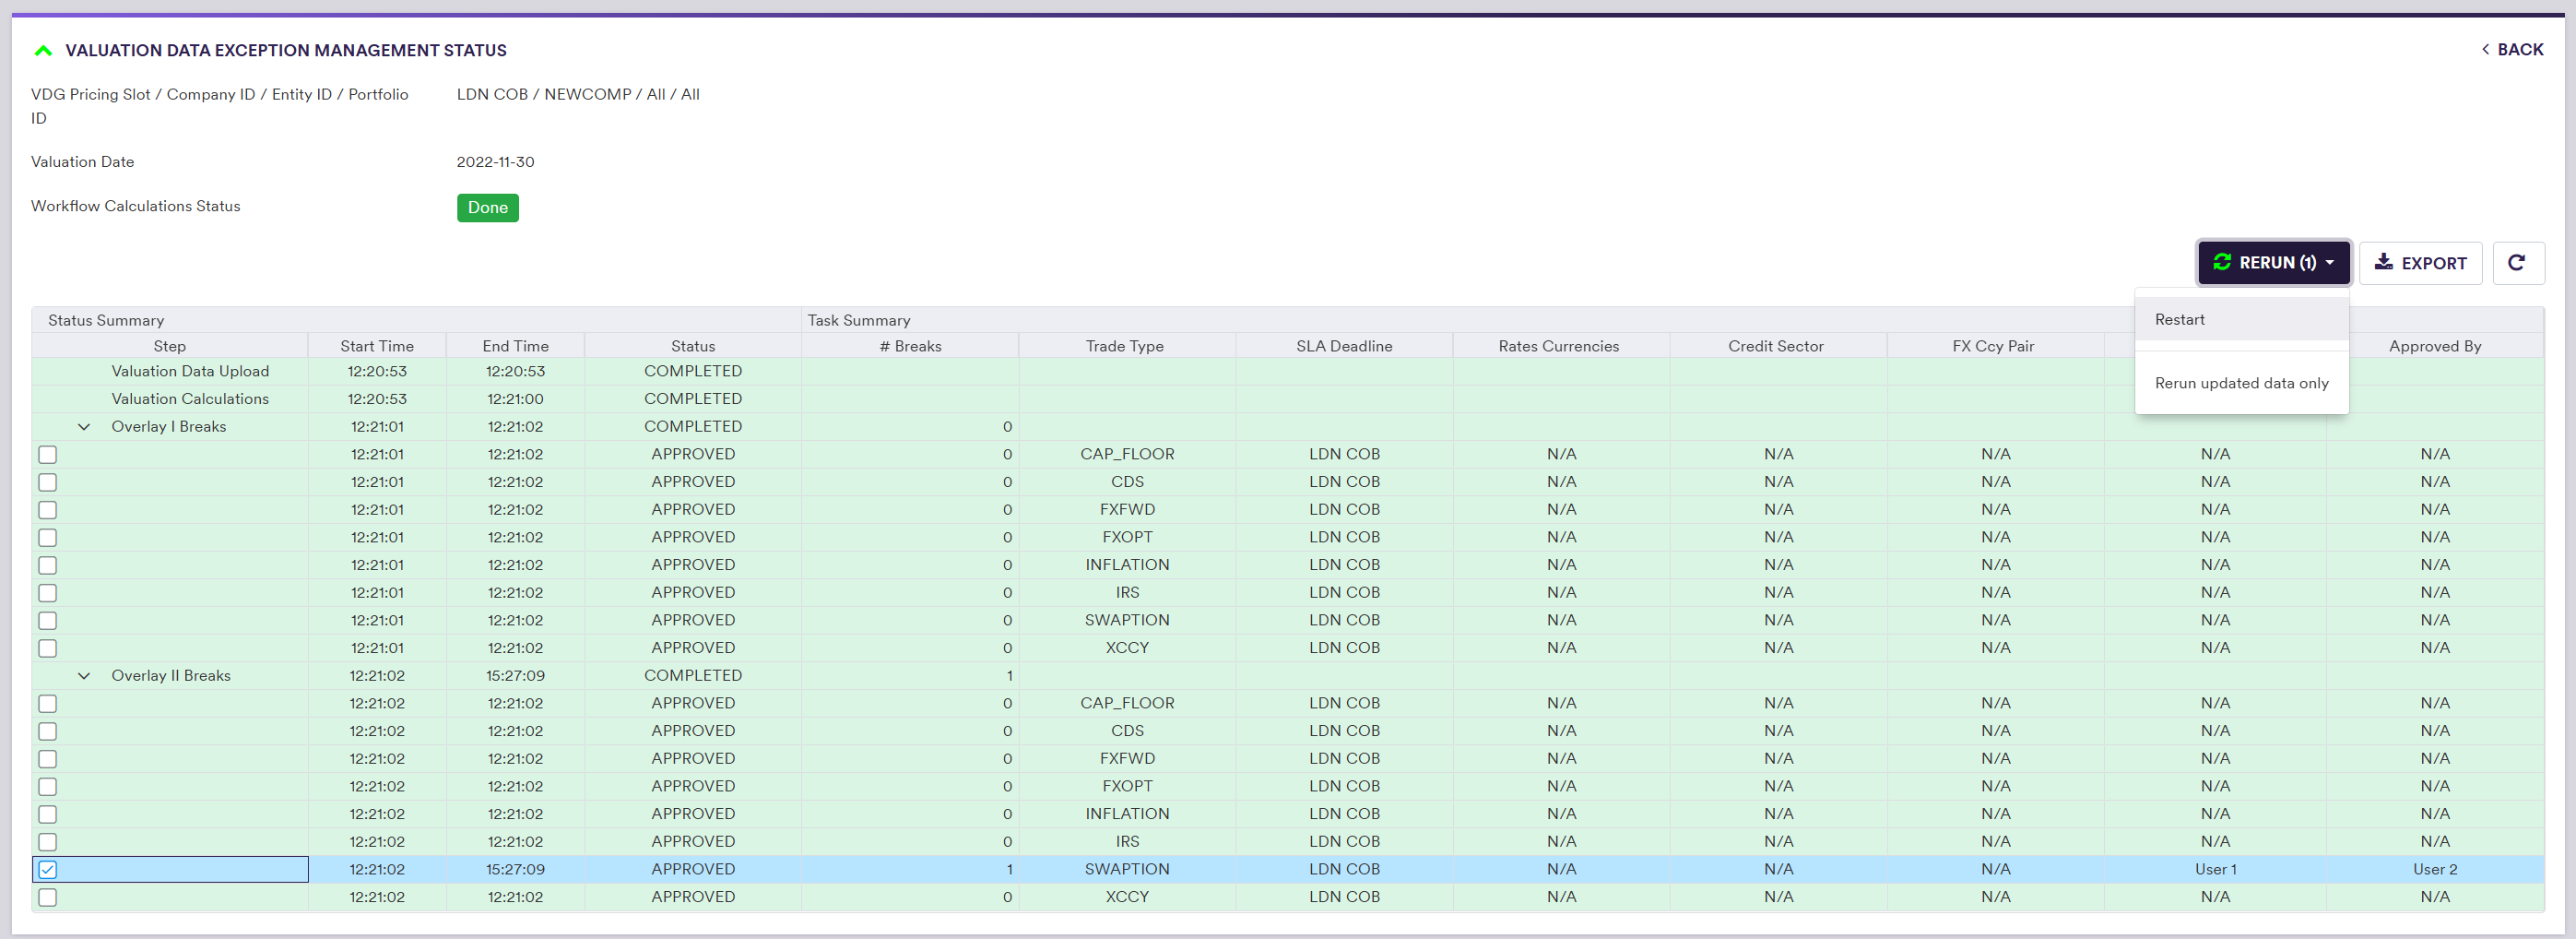
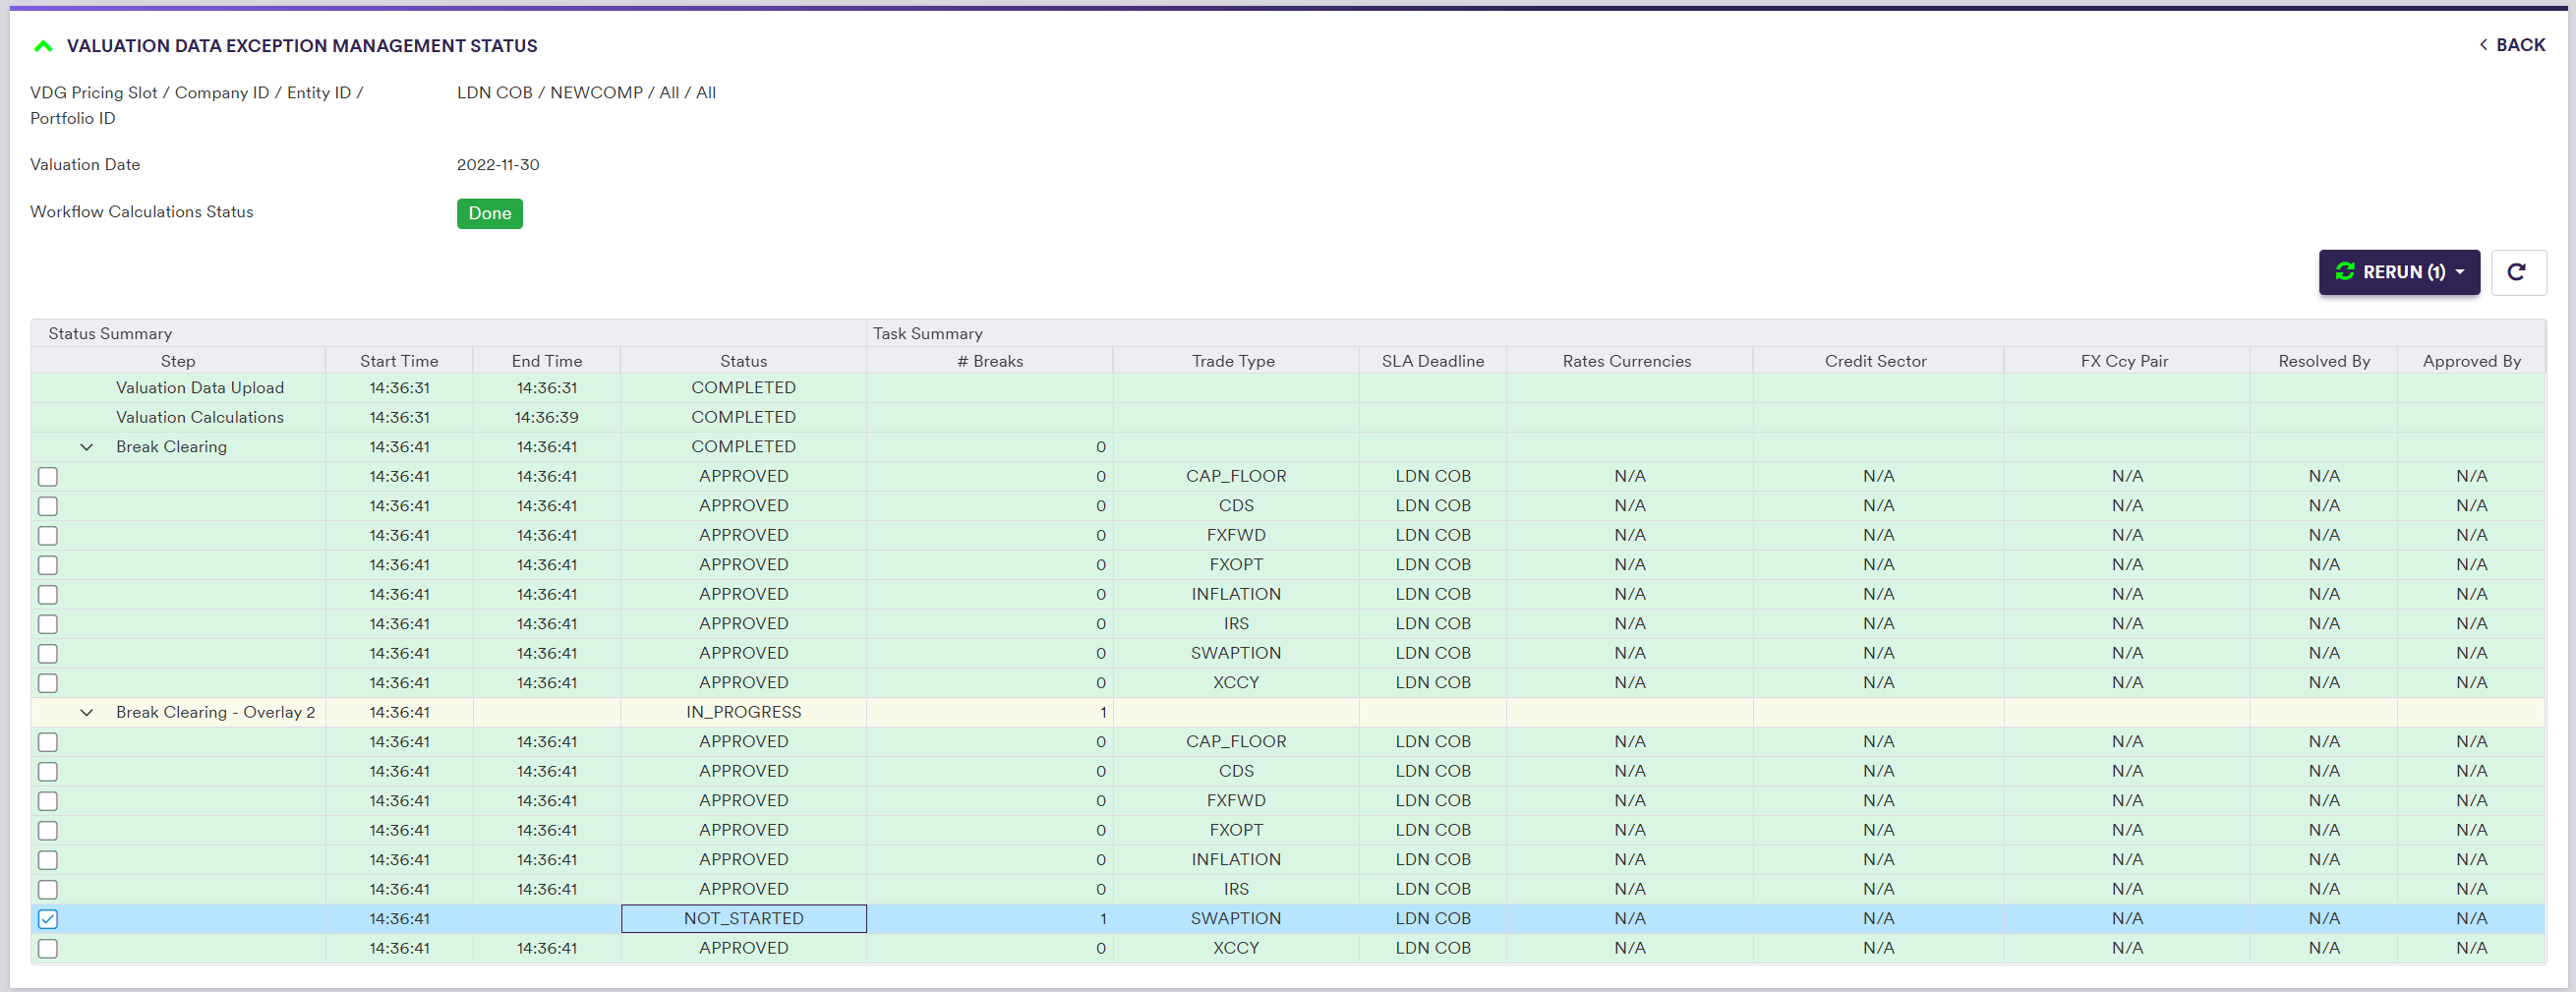
Re-running a Stream
At any point of the VD XM workflow, at the dashboard level, you can re-run a (selection of) stream(s) from the current clearing phase.
After selecting the stream(s) you wish to re-run, click on
-
Selecting ‘Re-run all trades’ will delete all resolution/approval records and re-run break tests for all trades within a given stream for the current clearing phase. (1)
-
Selecting ‘Re-run trades with updated valuation data’ will only do so for trades with updated valuation data. As such, this option will not impact break resolution in respect of trades with unchanged valuation data.
Both re-run options will be applied to the original trade universe (i.e. ignoring new trades and including archived trades).
Once the new break test report is completed, resolution tasks corresponding to the re-run stream(s) (if any) will (re-)appear in the live task list with the status ‘Not Started’. (1)