If you have to cleanse and validate stale market data, for multiple dates, within a specific time window, and keep an audit trail of your validation workflow, you can use Xplain’s batch anomaly detection module for market data.
You can also use our market data anomaly detection module, valuation data anomaly detection module or our trade onboarding module, which are based on a similar methodology.
We will use the term batch MD XM or batch market data XM when referring to batch market data cleansing.
On this page, we will describe how to:
You can view and export the results of the data cleansing process “as-you-go”, including raw and preliminary cleansed cleansed data (as described below), with the triggered breaks and corresponding resolution applied where applicable.
The Prerequisites
In terms of generic prerequisites, you can refer to or use the predefined break tests and task allocation settings, as described in the sandbox environment.
Completed Dashboard Example
You can view a completed dashboard related to the ‘3PM LONDON’ market data group (linked to the ‘BLUESTONE’ company) or to the ‘COB LONDON’ market data group (linked to the ‘LONDON_FICC’ company). Alternatively, you can replicate the completed ‘COB LONDON’ dashboard by starting your own MD XM workflow.
This page will guide you through the process using an example: running the anomaly detection process as at 30 November 2022 on ‘NEW Market Data GROUP’ and ‘NEWCOMP’, after uploading “corrupted” EUR 10y swap rate (vs. EURIBOR 6M) data.
The .CSV import files with the relevant data can be downloaded here.
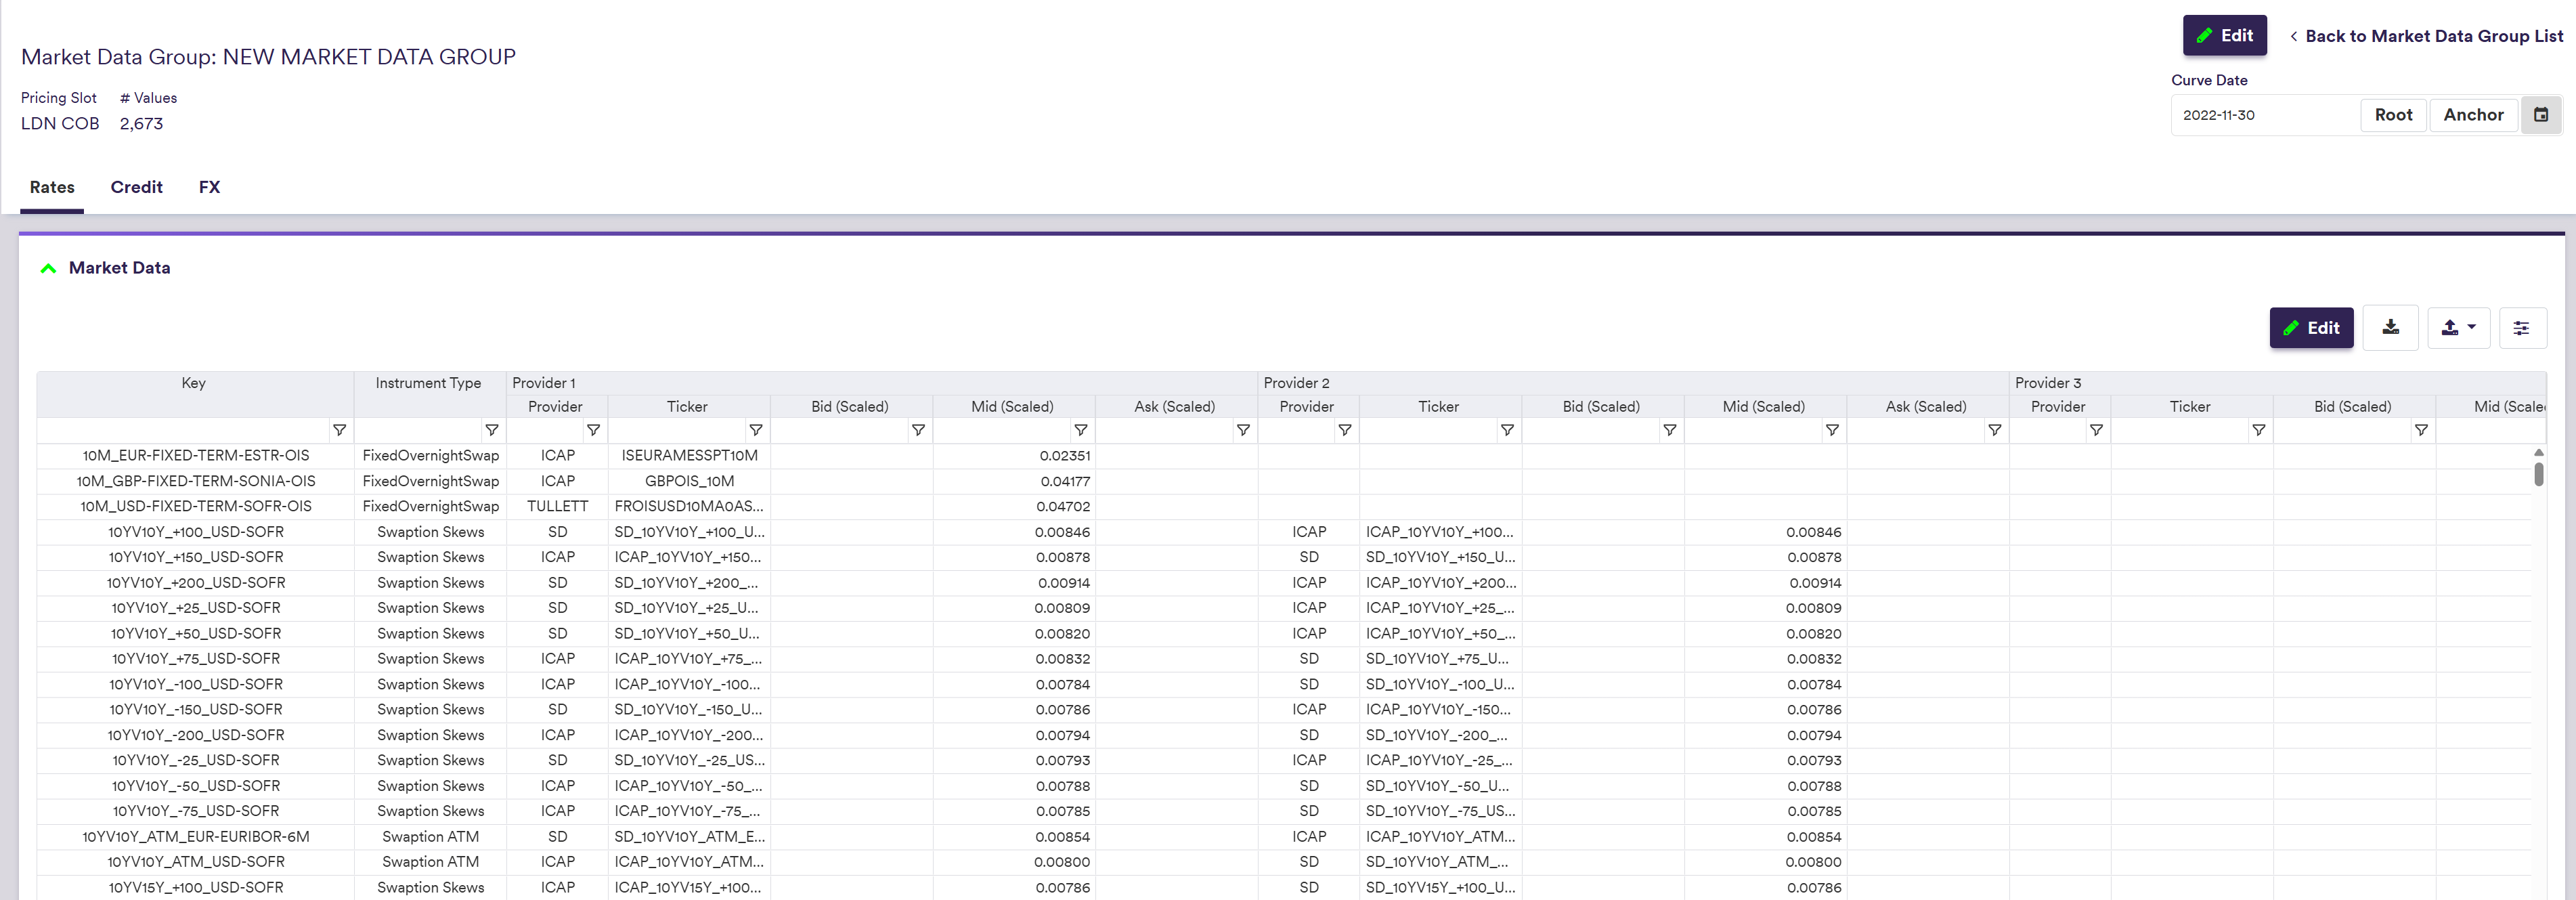
Setting up the Market Data Environment for the Example MD XM
To replicate the worked example below, you will first need to import market data that will trigger breaks during the data cleansing workflow. The .CSV import file with corrupted market data can be downloaded here. ![]()
Once imported, you can start an MD XM dashboard.
In our worked example, we will trigger a Quantum break, one of our example preliminary break tests, by assigning an incorrect value of 10,000,000 to the EUR 10y swap rate (vs. EURIBOR 6M) provided by ICAP (our example primary provider). Our second example break test (the EUR IRS Source to Source overlay break test) will also breach the 5% threshold applied to the relative difference between the ICAP preliminary cleansed data and the TULLETT data (secondary provider).
Under
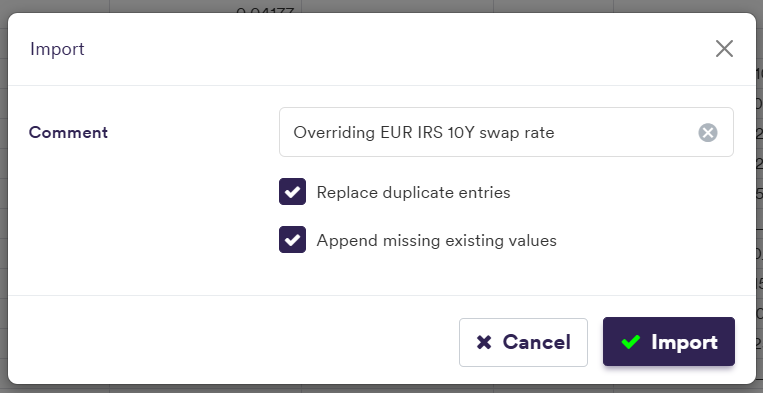
You will need to select the option to Replace duplicate entries to override the existing EUR 10y swap rate (vs. EURIBOR 6M) with the corrupted market data and to Append missing existing values that are not in the import file (see the versioning page for more detail).
Applying MDK filter '10Y_EUR-FIXED-1Y-EURIBOR-6M'

To restore the initial market data environment, you will need to import overriding data without anomaly. The .CSV import file with initial market data can be downloaded here. ![]()
Again, you will need to select the option to Replace duplicate entries to override the existing corrupted market data and to Append missing existing values that are not in the import file.
Market Data XM Dashboard
Once you have met the generic prerequisites and have a default pricing environment ready (see above for our worked example), you can create a dashboard to start the MD XM workflow.
You can then monitor the MD XM workflow progress via the dashboard. How break tests are applied for market data and how break clearing phases may require your resolution and approval input (if there are any breaks) are described in further detail below.
You can view and export the results of the data cleansing process “as-you-go”, including raw, preliminary cleansed and overlay cleansed data (as described below), with the triggered breaks and corresponding resolution applied where applicable.
Market Data XM Dashboard Creation
Under
- click on
Add New (or view an exiting one by double-clicking on the line item) - input the relevant parameters (i.e. market data group and curve date)
- click on
Create

setting Market Data Group = 'NEW Market Data GROUP' and Curve Date = '2022-11-30'

| Field Name | Description | Permissible Values |
|---|---|---|
| (TRS) Market Data Group | The data group that contains the raw (TRS) market data | Any existing (TRS) market data group |
| Curve Date | The curve date (set by default to the system's anchor date) | YYYY-MM-DD (ISO 8601) |
| Relevant market data only | Whether to clean all market data or only data required to value the portfolios associated to the market data group (via the parent Company / Entity's valuation settings) | Boolean |

You can then start the MD XM workflow by clicking on
Under
- from ‘Not Started’, after clicking on
Create - to ‘In Progress’, after clicking on
Run - to ‘Completed’, once all break clearing phases are completed
%%{init:{
  'flowchart':{
    'nodeSpacing': 50,
    'rankSpacing': 50,
    'diagramPadding': 5
  }
}}%%
flowchart TB

A["Not Started"]
B["In Progress"]
C["Completed"]

subgraph title[Dashboard Status]
A --> B
B --> C
end

classDef subgraphStyle font-weight:bold,fill:none,stroke:#805CDD,stroke-width:1px;
classDef xplStyle fill:#805CDD,stroke:#333,stroke-width:1px,color:#fff;

class title subgraphStyle;
class A,B,C xplStyle;
After clicking on

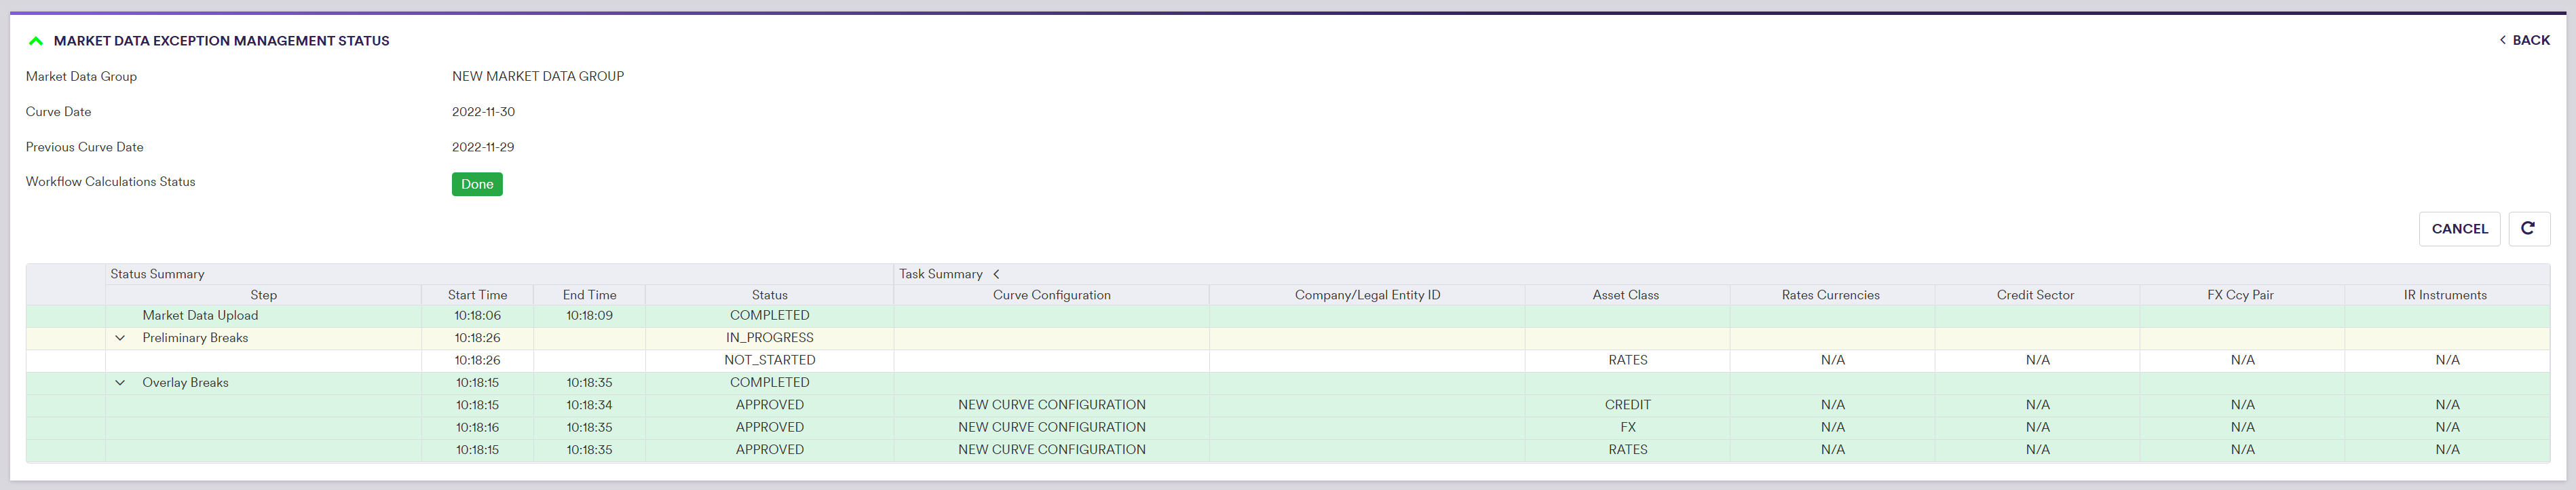
Dynamic MD XM Workflow Progress Monitoring
Under
The phases of the MD XM workflow which are illustrated in the dashboard are as follows:
- ‘Market Data Upload’ (performed by Xplain)
- ‘Preliminary Breaks’ clearing phase (may be subject to your resolution / approval input within a task) (*)
- ‘Overlay Breaks’ clearing phase (may be subject to your resolution / approval input within a task) (*)
(*) To resolve any potential breaks identified by Xplain when applying preliminary or overlay break tests for market data
The two break clearing phases will be split into streams according to the task granularity settings, with the ‘Overlay Breaks’ clearing phase split by curve configuration first.

The overall status of each phase are as follows:
%%{init:{
  'flowchart':{
    'nodeSpacing': 50,
    'rankSpacing': 50,
    'diagramPadding': 5
  }
}}%%
flowchart TB

A["NOT_STARTED"]
B["IN_PROGRESS"]
C["COMPLETED"]

subgraph title[Dashboard Phase Status]
A --> B
B --> C
end

classDef subgraphStyle font-weight:bold,fill:none,stroke:#805CDD,stroke-width:1px;
classDef xplStyle fill:#805CDD,stroke:#333,stroke-width:1px,color:#fff;

class title subgraphStyle;
class A,B,C xplStyle;
The status of a break clearing phase will be set to ‘NOT_STARTED’ if the status of all its streams is ‘NOT_STARTED’. It will be set to ‘IN_PROGRESS’ if at least one of its streams is ‘IN_PROGRESS’. It will be set to ‘COMPLETED’ if the status of all its streams is ‘COMPLETED’.
As soon as a break has been resolved and approved, you can see the corresponding MD XM results at the dashboard level.

If you have imported corrupted market data to ‘NEW Market Data GROUP’ to trigger a break during the MD XM workflow, you can now either restore the original market data (as described above) or perform curve calibration and portfolio valuation using the overlay cleansed data.
Market Data XM Break Test Workflow
For each curve node and volatility point, Xplain automatically generates a unique identifier, referred to as a market data key (MDK), which is derived from the instrument’s characteristics (e.g. tenor) and the underlying index convention.
MDKs are used in Xplain to map market data to the relevant instrument, including when performing market data anomaly detection.
For preliminary break tests, Xplain will generate a break test calculation for each [MDK + data provider] combination. For example, the ‘NULL’ test (which you cannot disabled) will be applied on every market data that is linked to a curve node or a volatility point via an MDK mapping in a given curve configuration. So if a curve node type is mapped to two providers, there could be up to two breaks to resolve.
The output resulting from a preliminary break resolution will be deemed to be the preliminary data. Overlay break tests will be applied on an MDK basis, based on the preliminary data.
You should note that if a data is missing (e.g. an unresolved ‘NULL’ preliminary value or no previous data available for a day-on-day test), break test calculations will simply not be performed however, this will not trigger breaks. (*)
(*) The latest date prior to the current date on which there is any market data available for the market data group in scope will be deemed to be the previous day.
You will need to resolve breaks in the relevant break clearing stream.
Break Clearing Phase Streams
During the MD XM workflow, the phases which may need your input are:
- the ‘Preliminary Breaks’ clearing phase, with associated preliminary break resolution tasks and approval tasks
- the ‘Overlay Breaks’ clearing phase, with associated overlay break resolution tasks and approval tasks
On the Break Clearing - Market Data Resolver page, we will start guiding you through break clearing for market data.
Each break clearing phase will be split into streams according to the task granularity settings, with the ‘Overlay Breaks’ clearing phase split by curve configuration first.
If there is no break identified following a break test calculation within a given stream, its status will directly be set to ‘APPROVED’. Otherwise, a break clearing task will be generated accordingly, starting with a resolution task.
The status of the break clearing phase’s stream will evolve as follows:
%%{init:{
  'flowchart':{
    'nodeSpacing': 50,
    'rankSpacing': 50,
    'diagramPadding': 5
  }
}}%%
flowchart TB

A["NOT_STARTED"]
B["IN_RESOLUTION"]
C["IN_APPROVAL"]
D["REJECTED"]
E["APPROVED"]

subgraph title["Stream Status <sup>(*)</sup>"]
A --> B
B --> C
C --> E
C --> D
D --> A
end

classDef subgraphStyle font-weight:bold,fill:none,stroke:#805CDD,stroke-width:1px;
classDef xplStyle fill:#805CDD,stroke:#333,stroke-width:1px,color:#fff;

class title subgraphStyle;
class A,B,C,D,E xplStyle;
(*) As we allow for partial break clearing, breaks within a stream may be at a different stage of the clearing process. For instance, some items may already be waiting for approval where some others may still be waiting for resolution. In this case, the status of the stream will be set to the most advanced status overall.
When expanded, the information related to a break clearing phase will set out the status of each stream.