There are two types of dashboard that each corresponds to a type of data cleansing or exception management (XM) process (i.e. market data or valuation data XM).
On this page, we will discuss:
- Market data XM dashboard
- Valuation data XM dashboard
- XM results and reporting
Market Data XM Dashboard Description
We will discuss the various steps related to a market data XM dashboard:
- Dashboard creation
- Dynamic progress monitoring overview
- Break clearing phase description
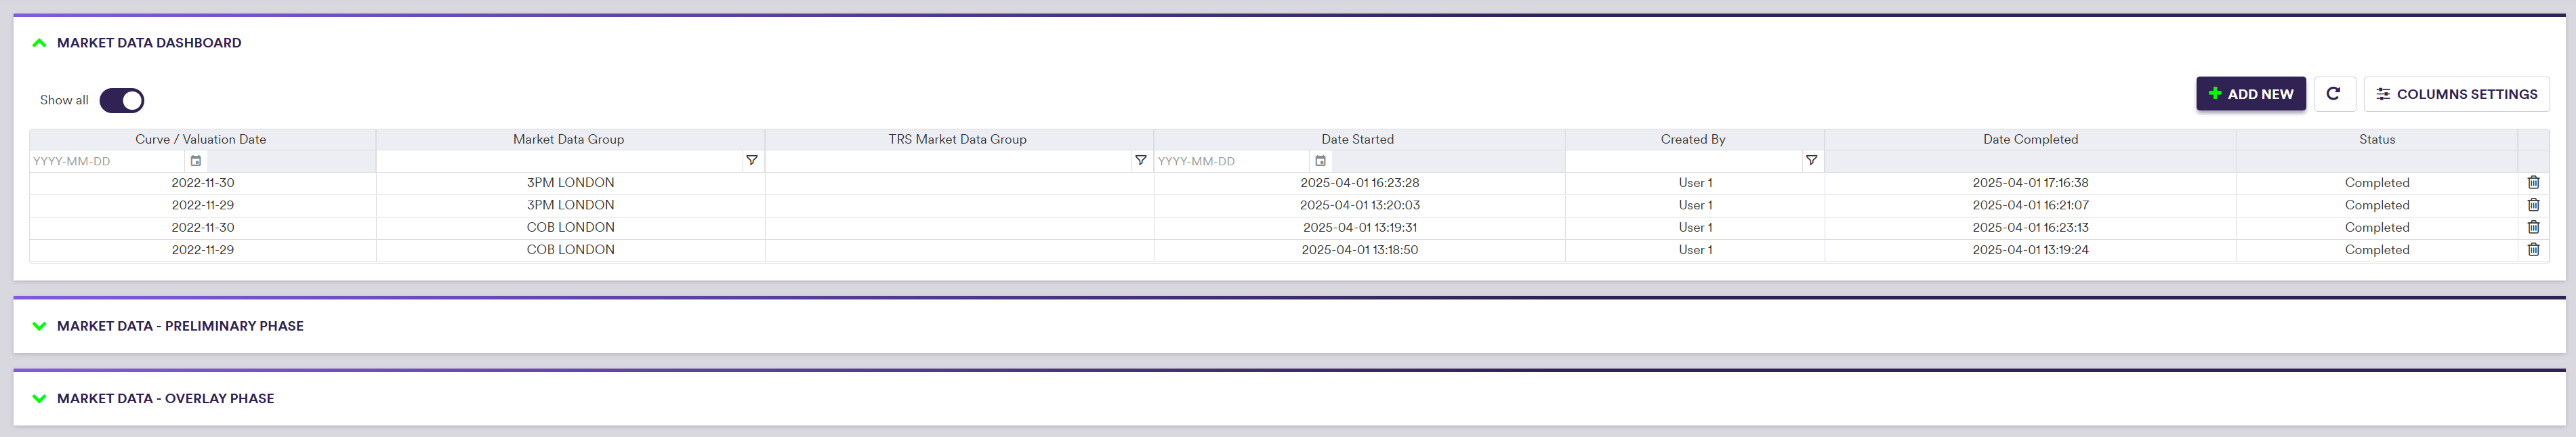
1. Market Data XM Dashboard Creation
For the purpose of this example, you have first uploaded imported modified market data to the NEW Market Data GROUP to trigger a break during the data cleansing workflow. The .CSV import file with these modified data can be downloaded here. You will need to choose the option to replace duplicate data to override the existing market data.
Under
- Click on
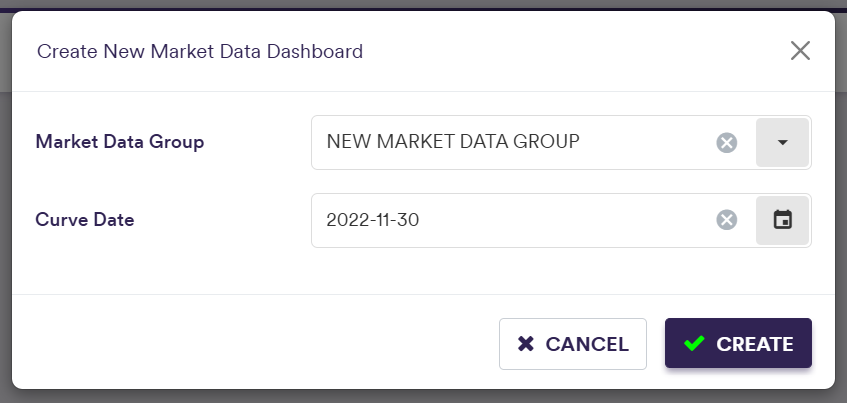
Add New (or view an exiting one by double-clicking on the line item) - Select the “Market Data” dashboard type
- Input the relevant parameters (e.g. market data group and curve date)
- Click on
CREATE
A description of a dashboard’s attributes and corresponding permissible values are set out in the table below.
| Field Name | Description | Permissible Values |
|---|---|---|
| Market Data Group | The market data group that contains the raw market data | Any existing market data group |
| TRS Market Data Group | The TRS market data group that contains the raw index market data | Any existing TRS market data group |
| Curve Date | The curve date (set by default to the system date) | YYYY-MM-DD (ISO 8601) |
You can then start the data cleansing workflow, by clicking on
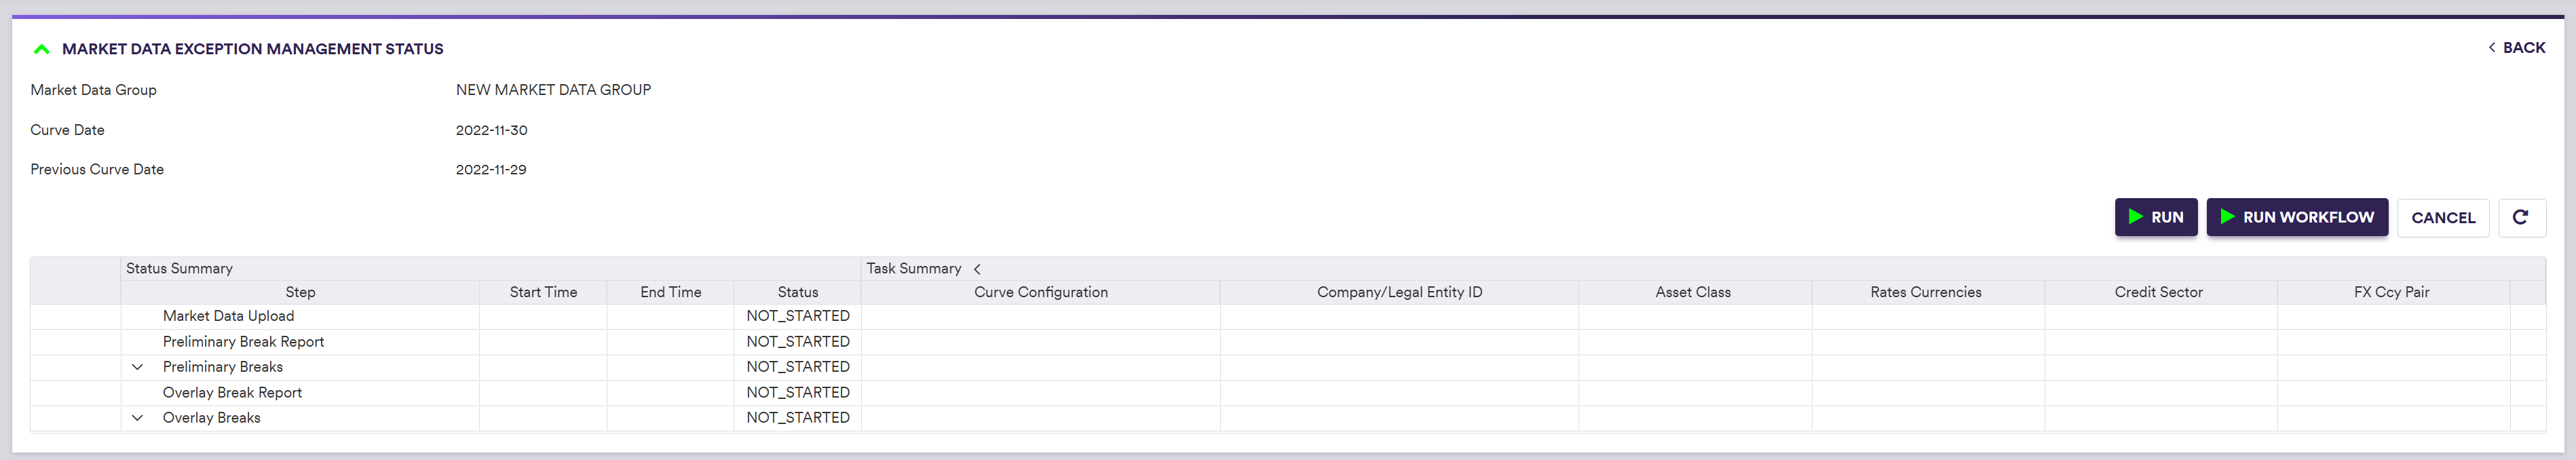
The status of a dashboard will go from ‘NOT_STARTED’ (after clicking on
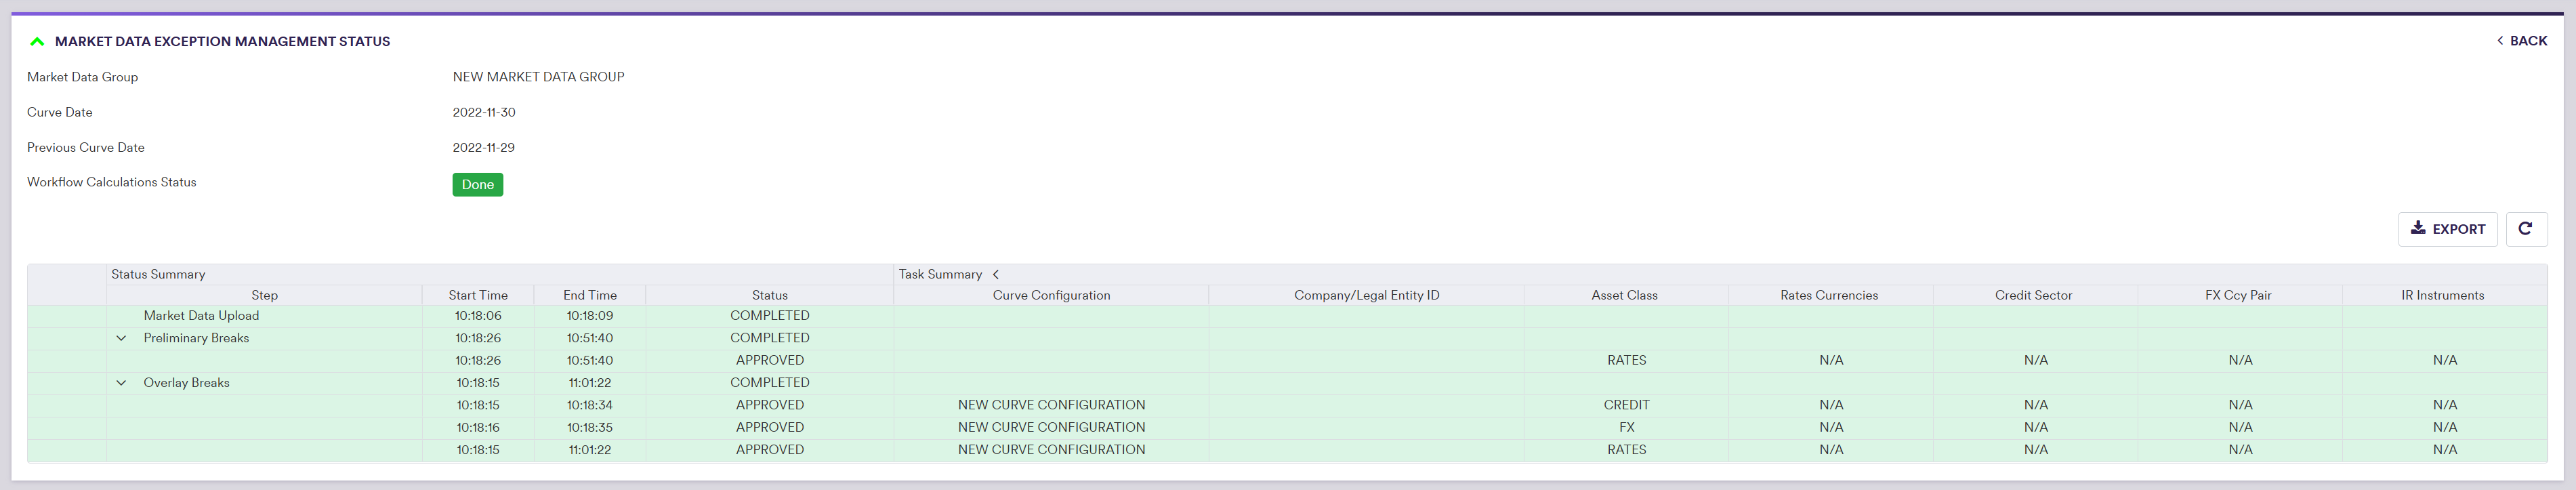
2. Dynamic Progress Monitoring Overview
The five phases of the data cleansing workflow related to market data are as follows:
- Market Data Upload
- Preliminary – break test calculation
- Preliminary - Break Clearing
- Overlay – break test calculation
- Overlay - Break Clearing
At the dashboard level, you can monitor the progress of the data cleansing workflow thought the evolution of each phase’s status that will go from ‘NOT_STARTED’ to “COMPLETED”, with an intermediary colour-coded status bar for the clearing phases.
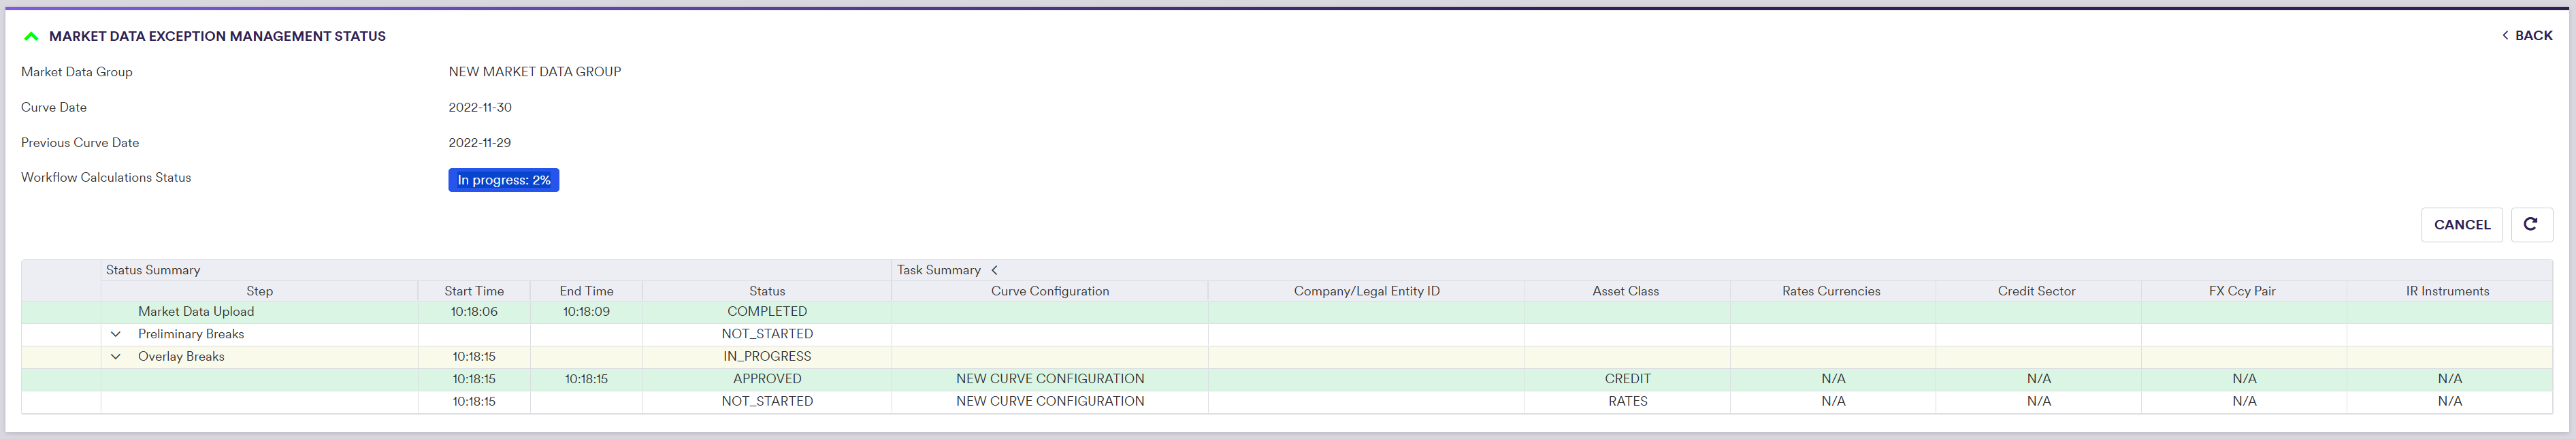
Once all breaks have been resolved and approved, you can see the XM results for market data at the dashboard level.
As you have first uploaded imported modified market data to the NEW Market Data GROUP to trigger a break during the data cleansing workflow, you can now either restore the original market data (as described below) or perform curve calibration and portfolio valuation using the Overlay data. The data needed to restore the original ones can be downloaded here. You will need to choose the option to replace duplicate data to override the existing modified market data.
3. Break Clearing Phase Description
A break clearing phase will be split into clearing tasks according to the task granularity settings per asset class.
When expanded, the information related to a clearing phase will set out the status of each underlying task.
If there are some breaks to be cleared (see clearing process), the task completion status and the colour (in bracket below) of the corresponding portion in the overall clearing phase status bar will evolve as follows:
- PENDING_RESOLUTION (grey)
- IN_RESOLUTION (royal blue)
- PENDING_APPROVAL (dark blue)
- IN_APPROVAL (turquoise)
- APPROVED (green)
Otherwise, if there is no break, the task’s status will automatically be set to ‘APPROVED’.
Valuation Data XM Dashboard Description
We will discuss the various steps related to a valuation data XM dashboard:
- Dashboard creation
- Dynamic progress monitoring overview
- Break clearing phase description
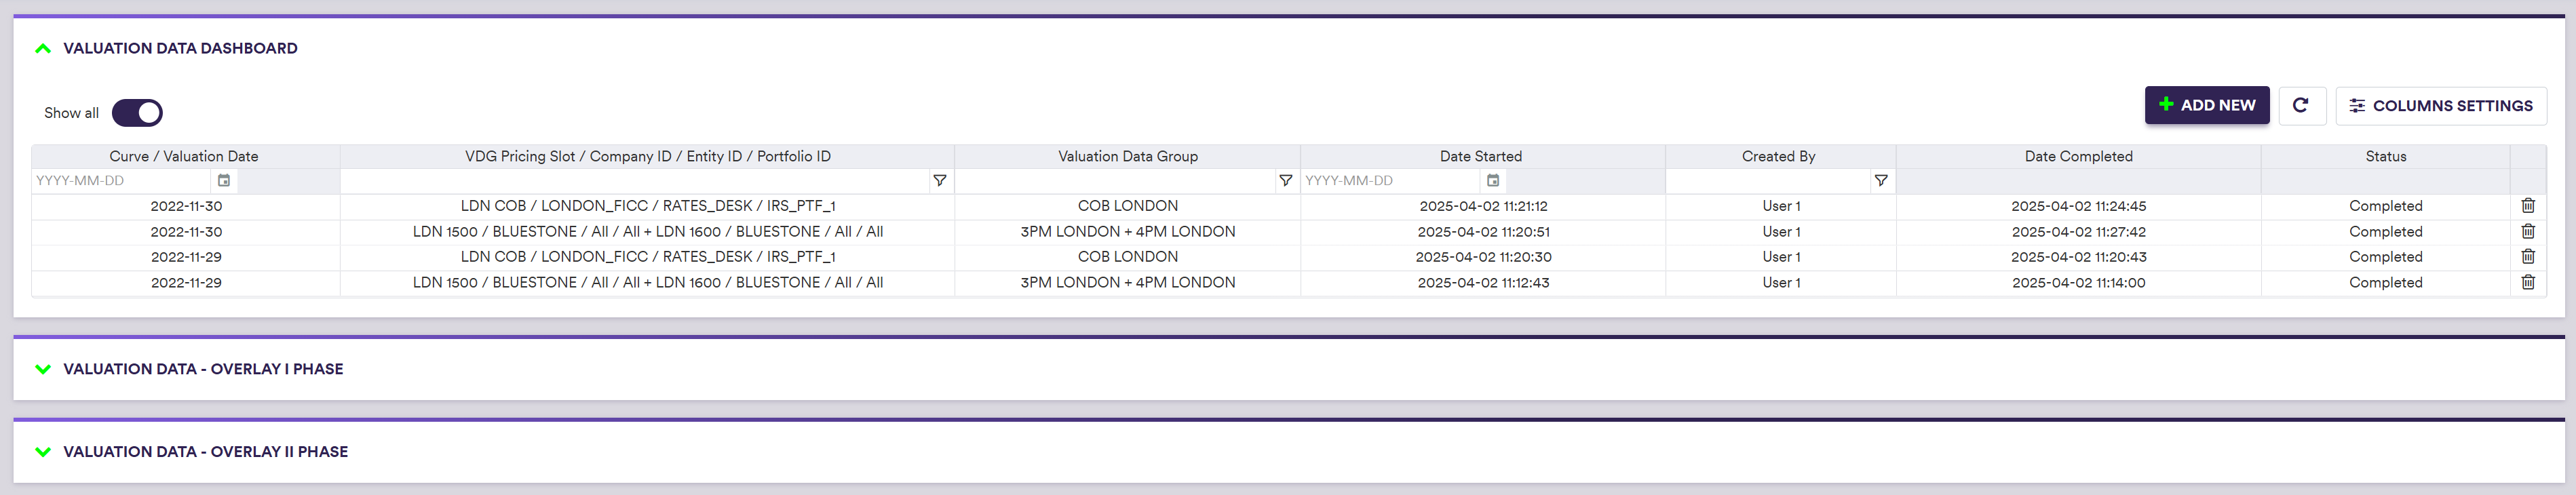
1. Valuation Data XM Dashboard Creation
Under
- Click on
Add New (or view an exiting one by double-clicking on the line item) - Select the “Valuation Data” dashboard type
- Input the relevant parameters (e.g. pricing slot and valuation date)
- Click on
CREATE
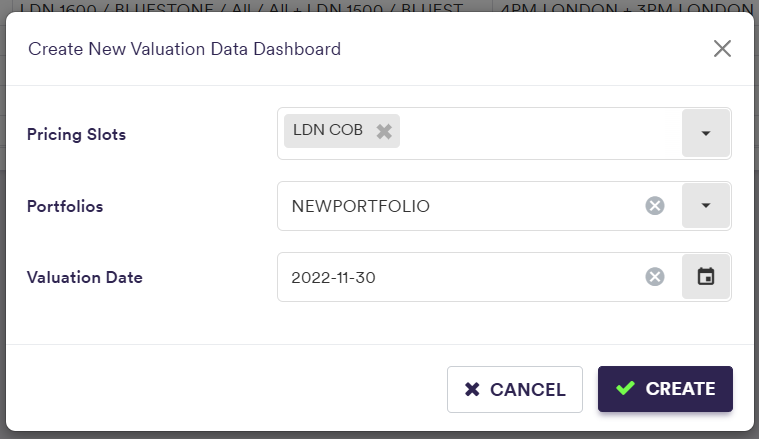
A description of a dashboard’s attributes and corresponding permissible values are set out in the table below.
| Field Name | Description | Permissible Values |
|---|---|---|
| Pricing Slots | A list of in-scope pricing slots | Any existing Pricing Slot |
| Portfolios | A list of companies / entities / portfolios | Any existing Company ID / Entity ID / Portfolio ID |
| Valuation Date | The valuation date (set by default to the system date) | YYYY-MM-DD (ISO 8601) |
You can then start the data cleansing workflow, by clicking on
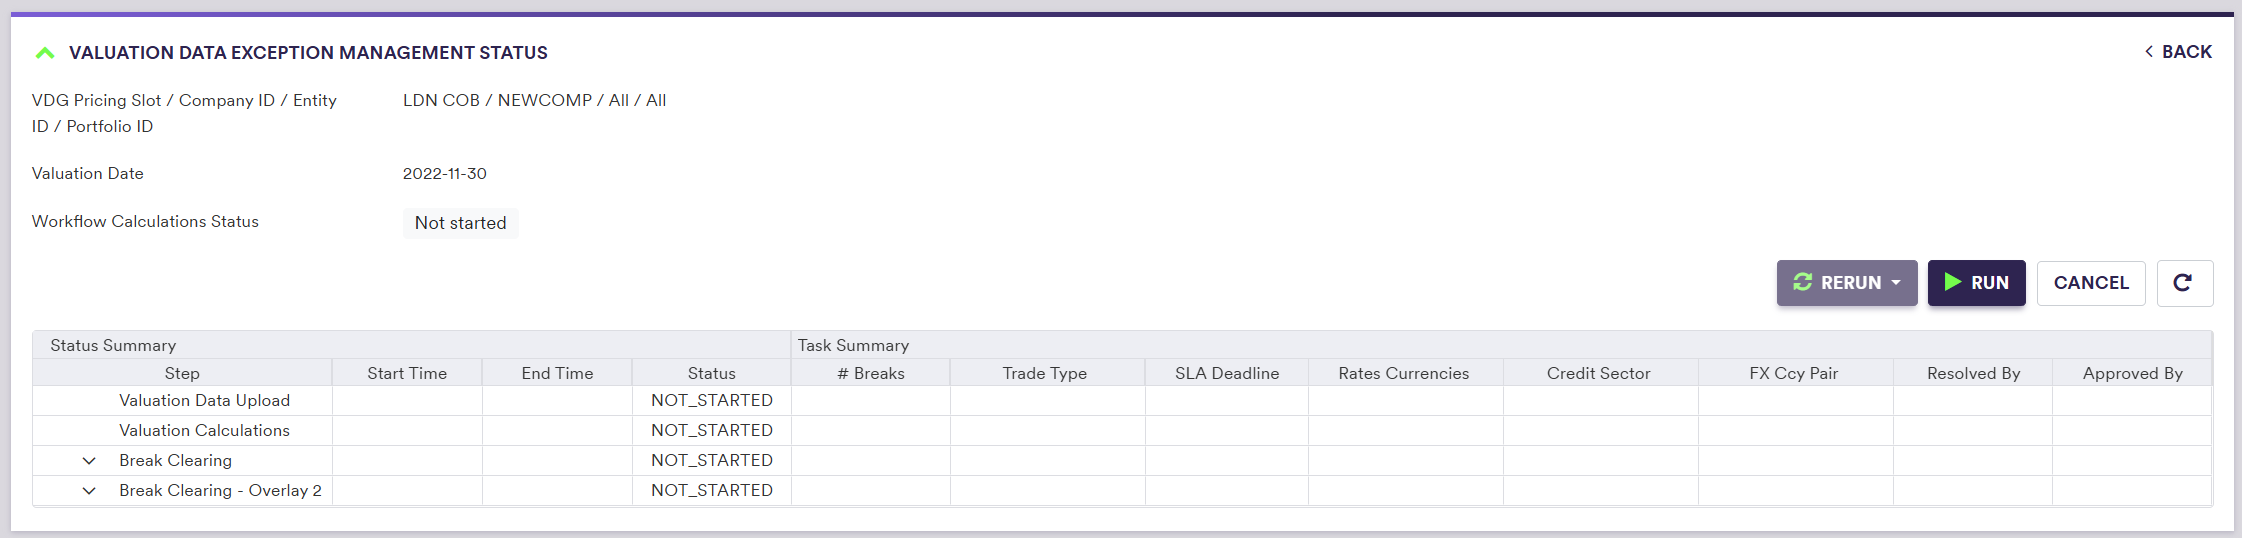
The status of a dashboard will go from ‘NOT_STARTED’ (after clicking on
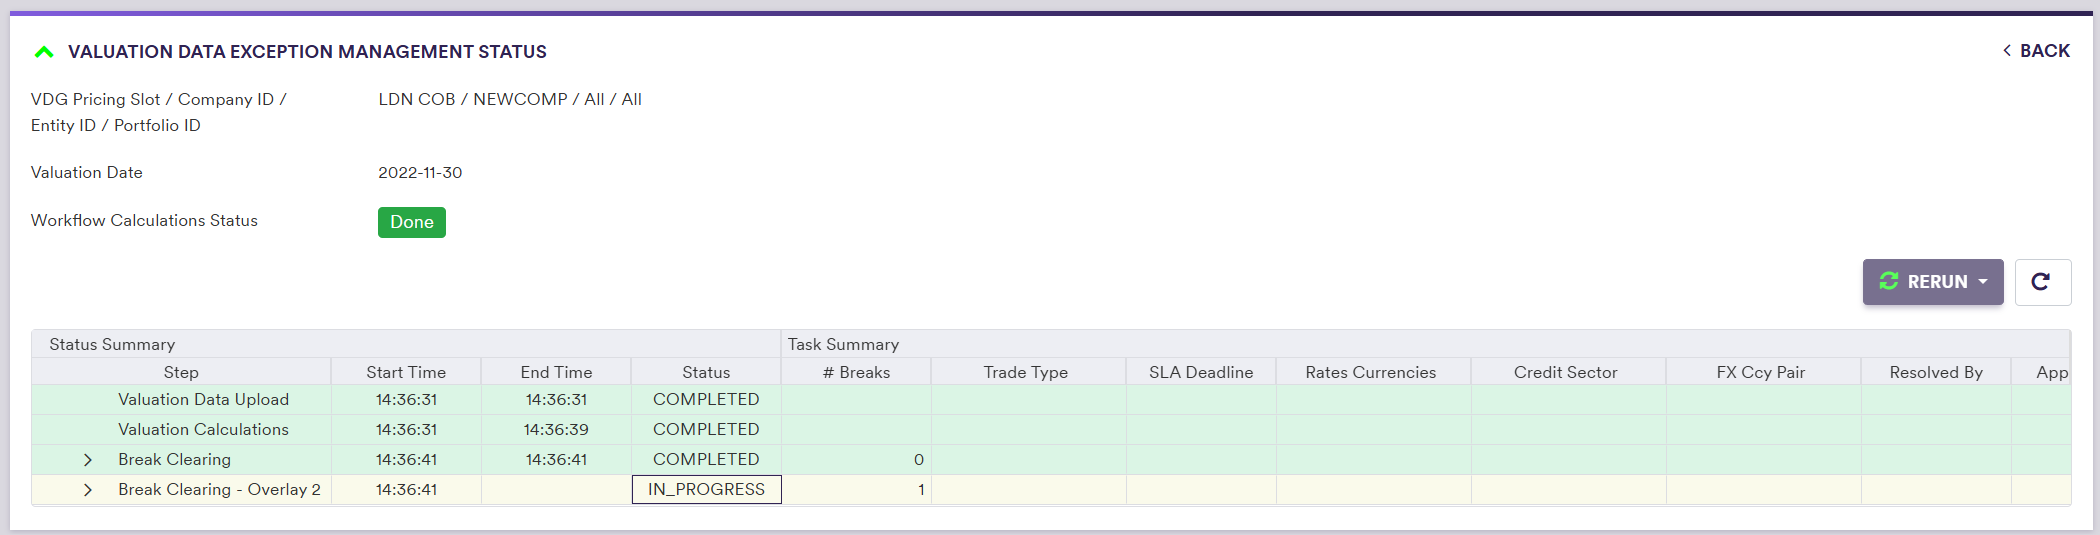
2. Dynamic Progress Monitoring Overview
The six phases of the data cleansing workflow related to valuation data are as follows:
- Valuation Data Upload
- Valuation Calculations (applicable only if Xplain is one of the valuation data providers)
- break test calculation
- Break Clearing
- Overlay II break test calculation
- Overlay II Break Clearing
At the dashboard level, you can monitor the progress of the data cleansing workflow thought the evolution of each phase’s status that will go from ‘NOT_STARTED’ to “COMPLETED”, with an intermediary colour-coded status bar for the clearing phases.
As breaks are resolved and approved (partial submission), you can see the XM results for valuation data at the dashboard level. Cleared data (i.e. with status “VERIFIED”) will be released “as-you-go”, with the caveat that data that triggered a break will only be released once the overall task has been approved.
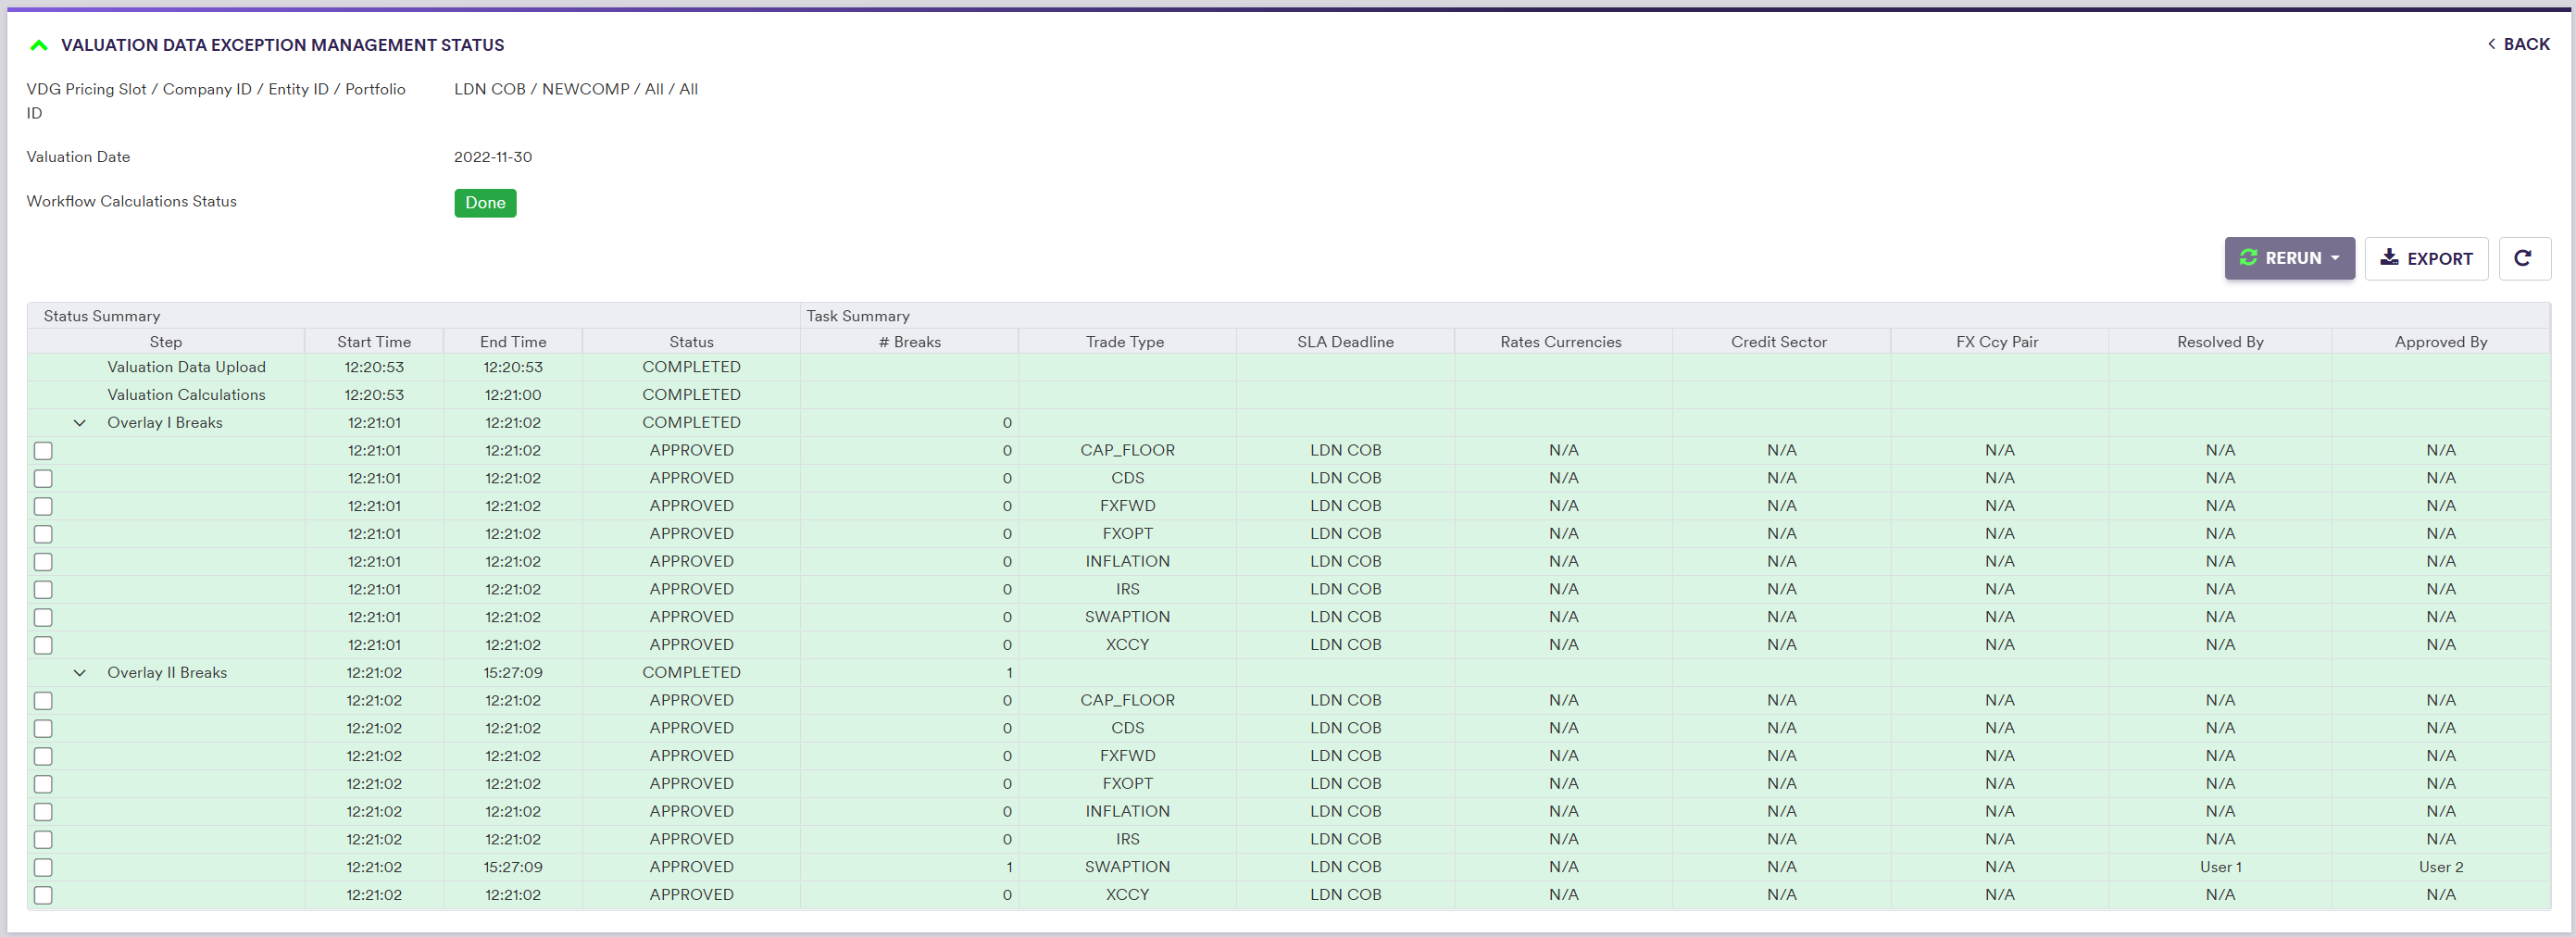
3. Break Clearing Phase Description
A break clearing phase will be split into clearing tasks according to the task granularity settings per trade type.
When expanded, the information related to a clearing phase will set out the status of each underlying task.
If there are some breaks to be cleared (see clearing process), the task completion status and the colour (in bracket below) of the corresponding portion in the overall clearing phase status bar will evolve as follows:
- PENDING_RESOLUTION (grey)
- IN_RESOLUTION (royal blue)
- PENDING_APPROVAL (dark blue)
- IN_APPROVAL (turquoise)
- APPROVED (green)
Otherwise, if there is no break, the task’s status will automatically be set to ‘APPROVED’.
At the VD dashboard level, you will have the option to select and re-run a task (in its entirety or updated valuation data only).
Data Cleansing Results
Once cleared data are released, you will have the ability to:
- View the MD and VD XM results, where applicable
- Override manually the VD results
- View Xplain’s PV Calculation results, if Xplain is one of the valuation data providers
- Use MD XM results (e.g. preliminary or overlay data) as a market data source when calibrating curves or valuing a portfolio, where applicable.
Cleared data (i.e. with status “VERIFIED”) will be released “as-you-go”, with the caveat that data that triggered a break will only be released once the overall task has been approved.
Saved results will have to be archived if you want to re-rerun the data cleansing workflow on the same market data group / pricing slot or portfolio and for the same curve/ valuation date.
After saving a Valuation Data dashboard, XM VD results will also be accessible on a trade level in the trade valuation history screen (see Trade Valuation History).
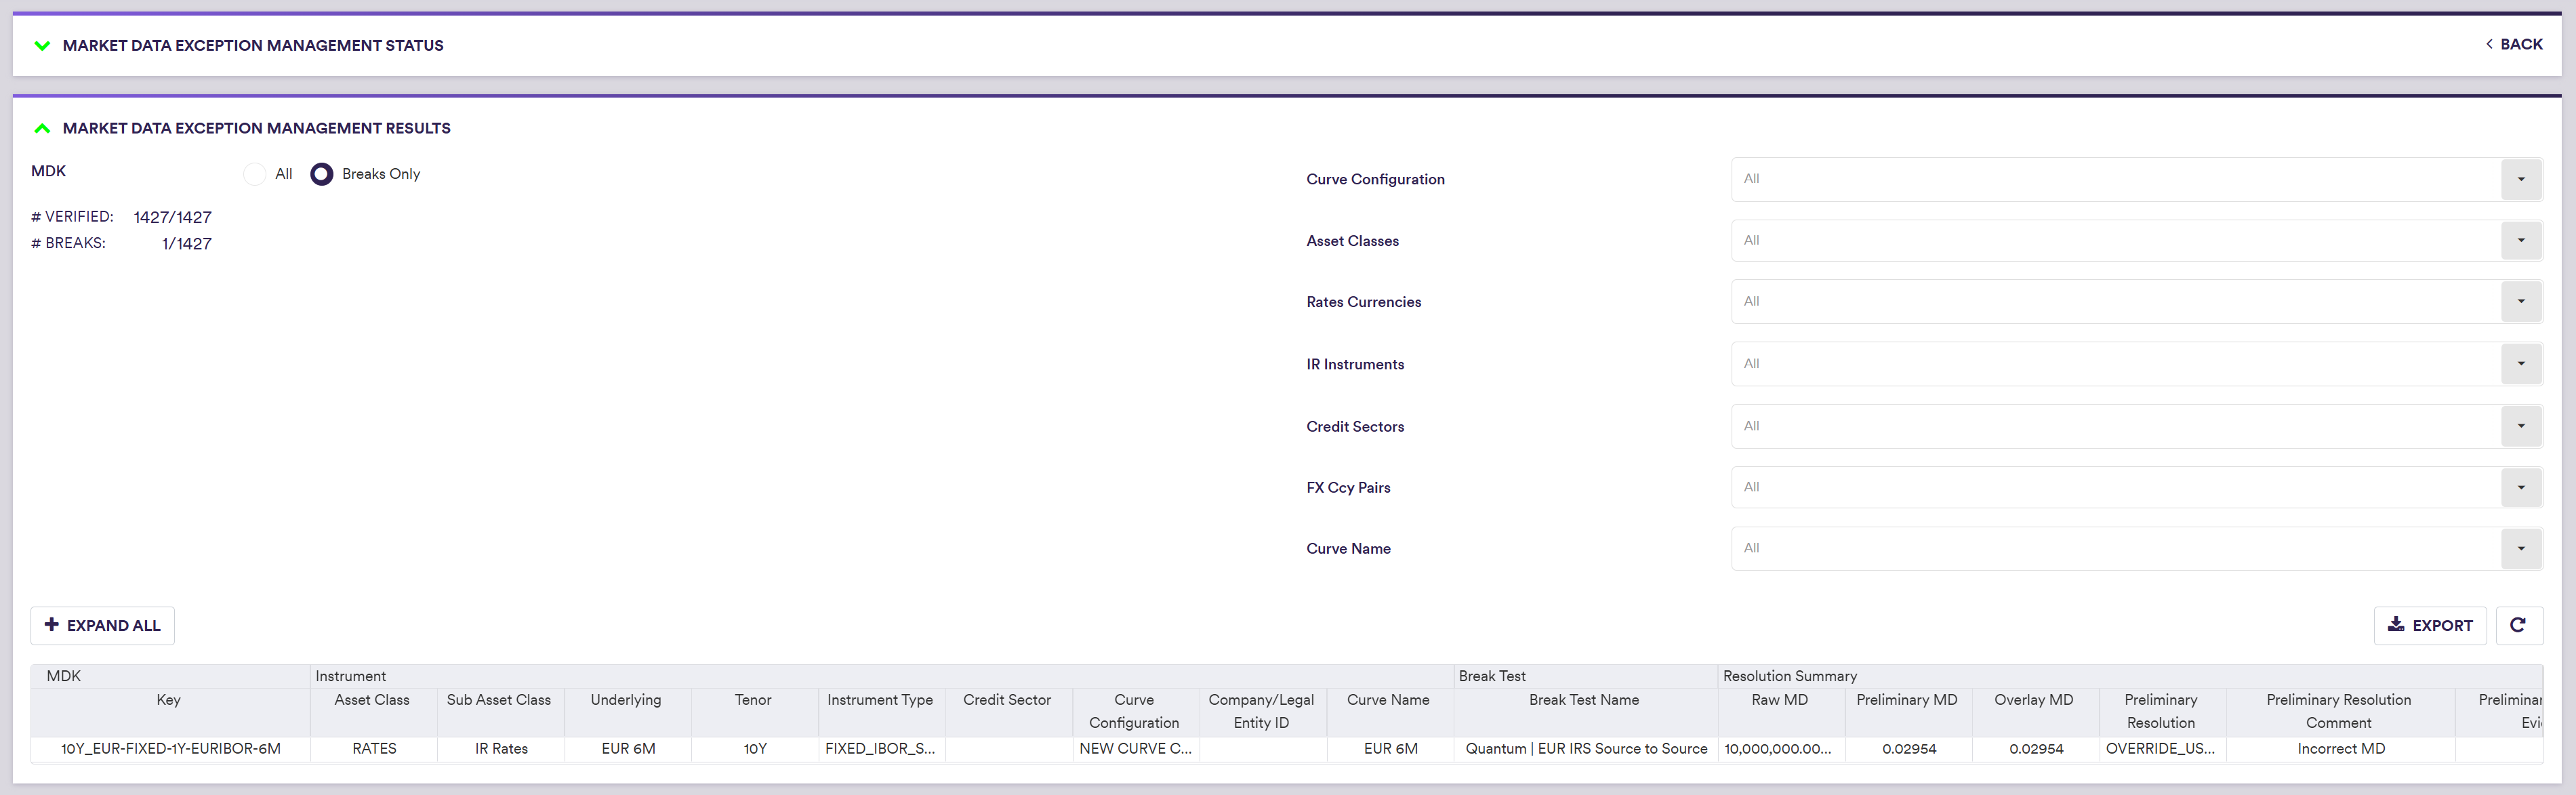
1. Viewing Data Cleansing Results
Once a market data XM workflow is completed, you can access/export the results in the “Market Data Data Cleansing Results” window.
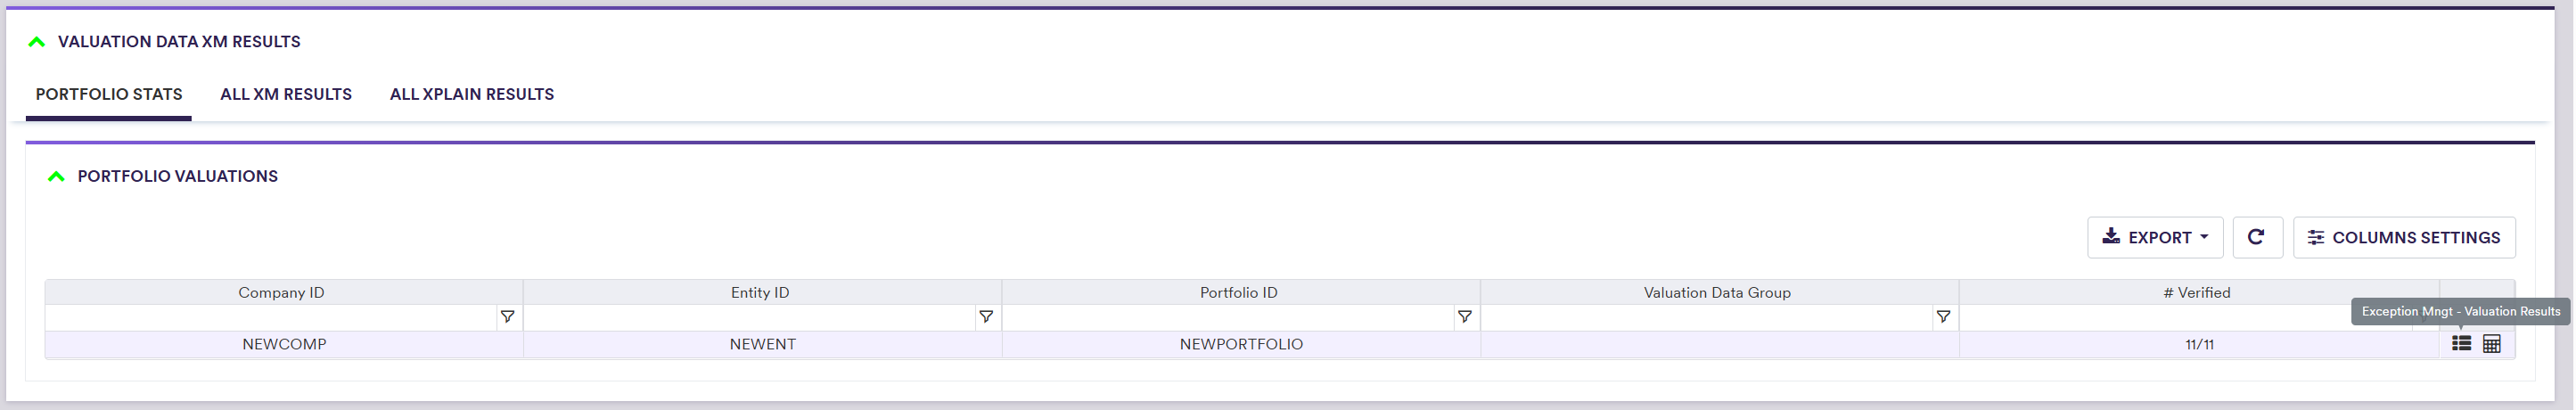
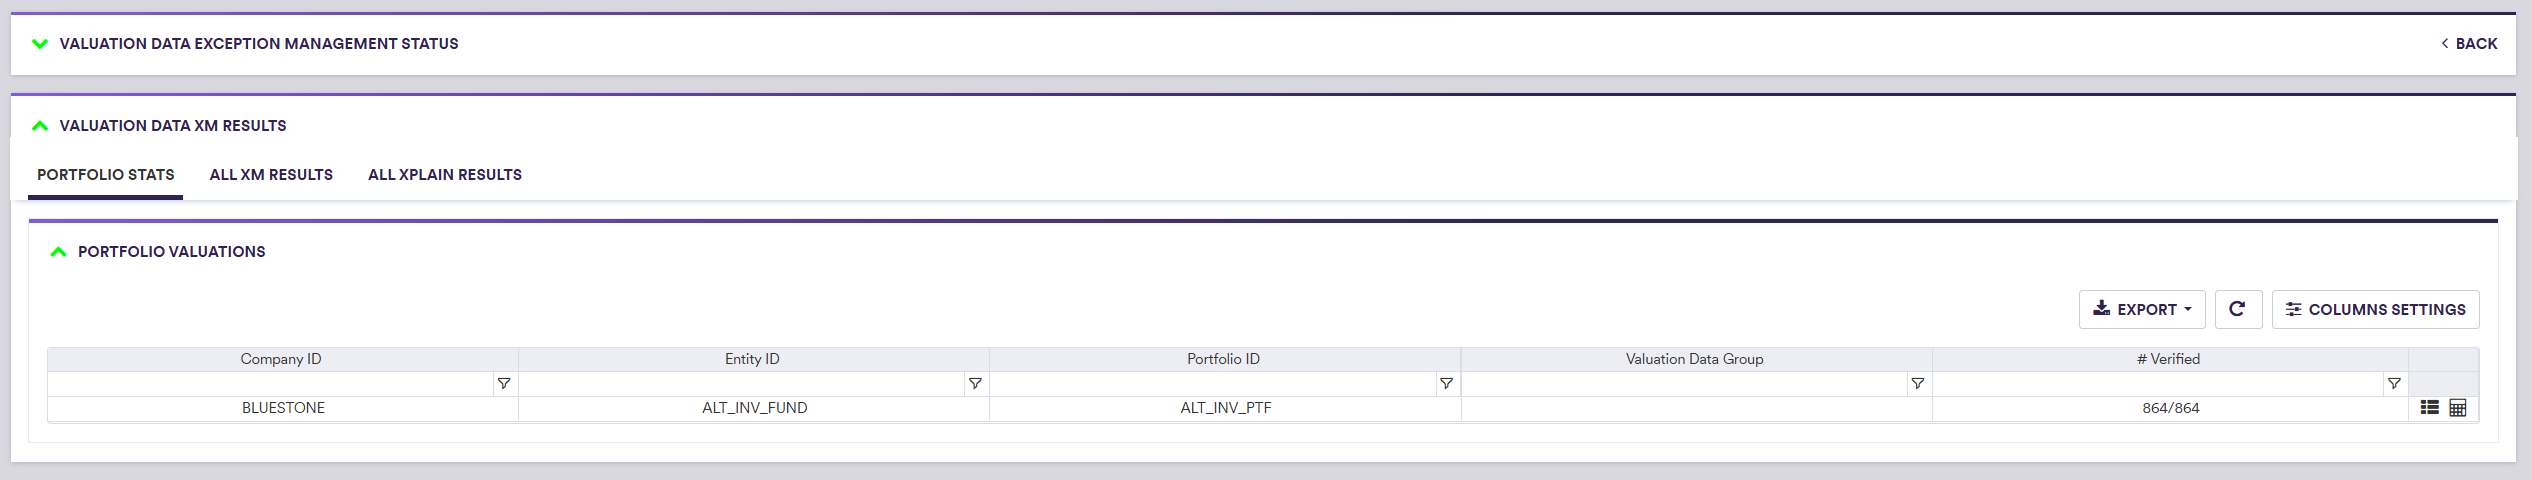
Through a valuation data XM workflow, as tasks get completed, you can access/export two types of valuation results by clicking on the relevant icon in the “PORTFOLIO Valuations” window:
- Valuation data XM results
- Xplain’s valuation results, for trades where Xplain is one of the valuation data providers
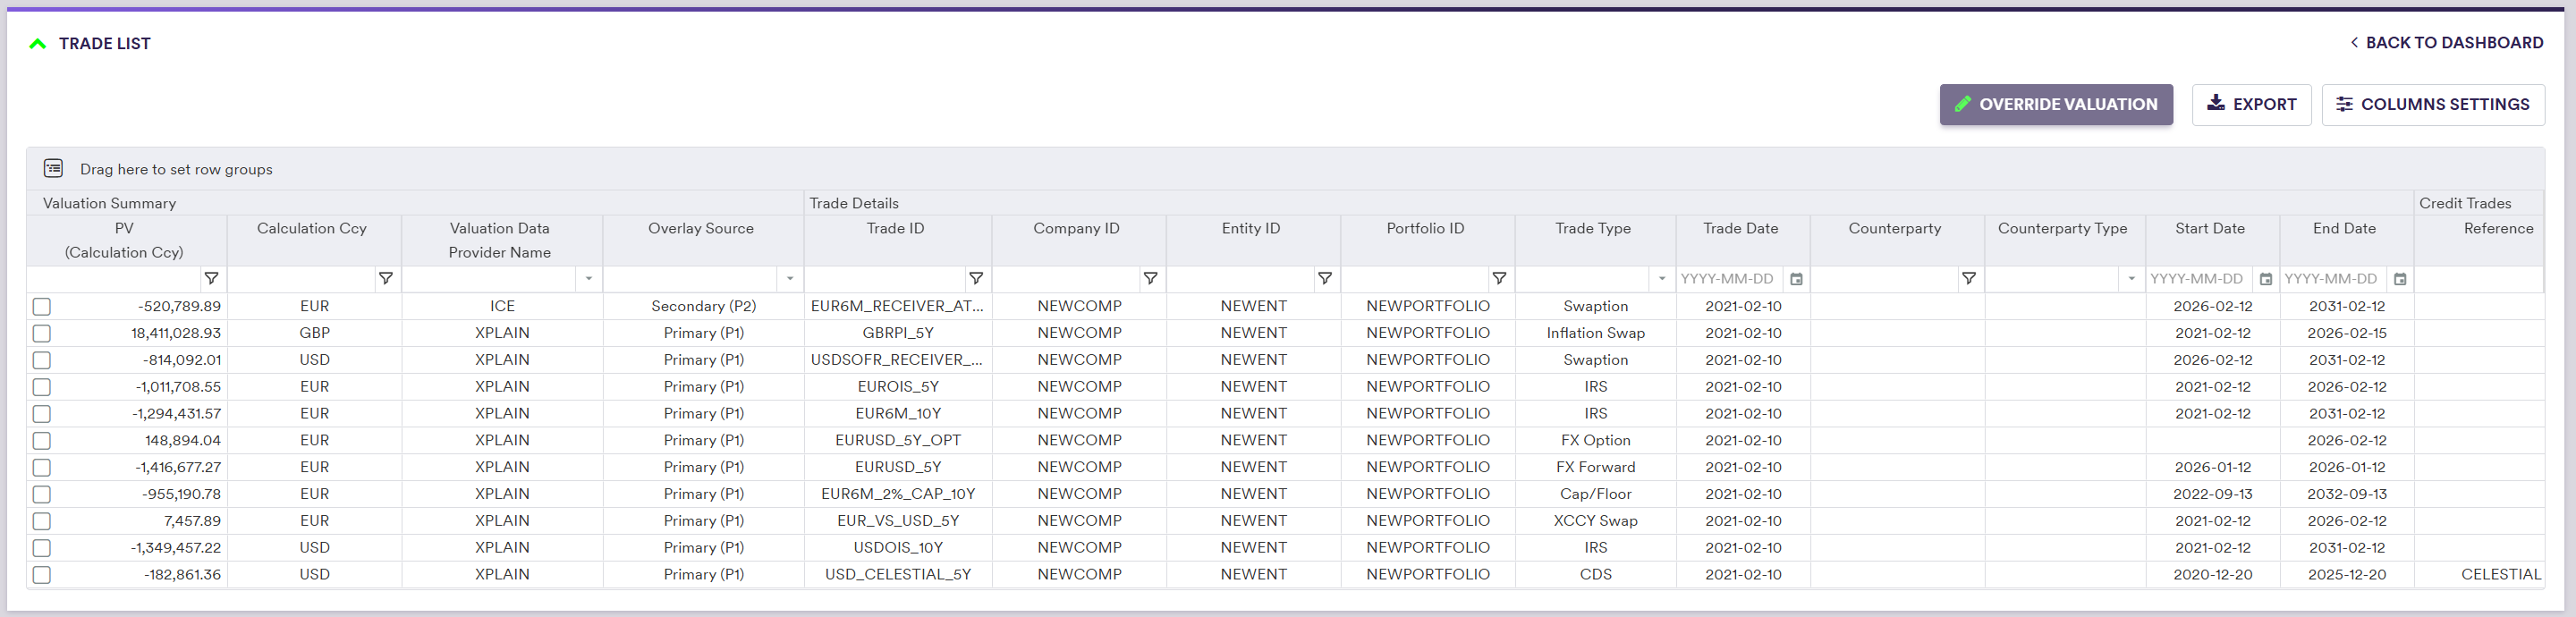
The VD data cleansing results will include a subset of each trade’s details, as well as the final valuation summary, as set out in the table below.
| Field Name | Description | Permissible Values |
|---|---|---|
| PV (Calculation Currency) | The final trade valuation following the VD XM workflow, expressed in the calculation currency | Numeric |
| Calculation Currency | The currency in which valuation data are expressed | The Trade Currency or the Reporting Currency, as applicable |
| Valuation Data Provider Name | The data provider associated to the data source of the final trade valuation | An existing valuation data provider |
| Overlay Source | The data source of the final trade valuation | Primary (P1) | Secondary (P2) | Tertiary (P3) | Quaternary (P4) | Accounting cost | Deal cost | Manual | Multiple | Do not price |
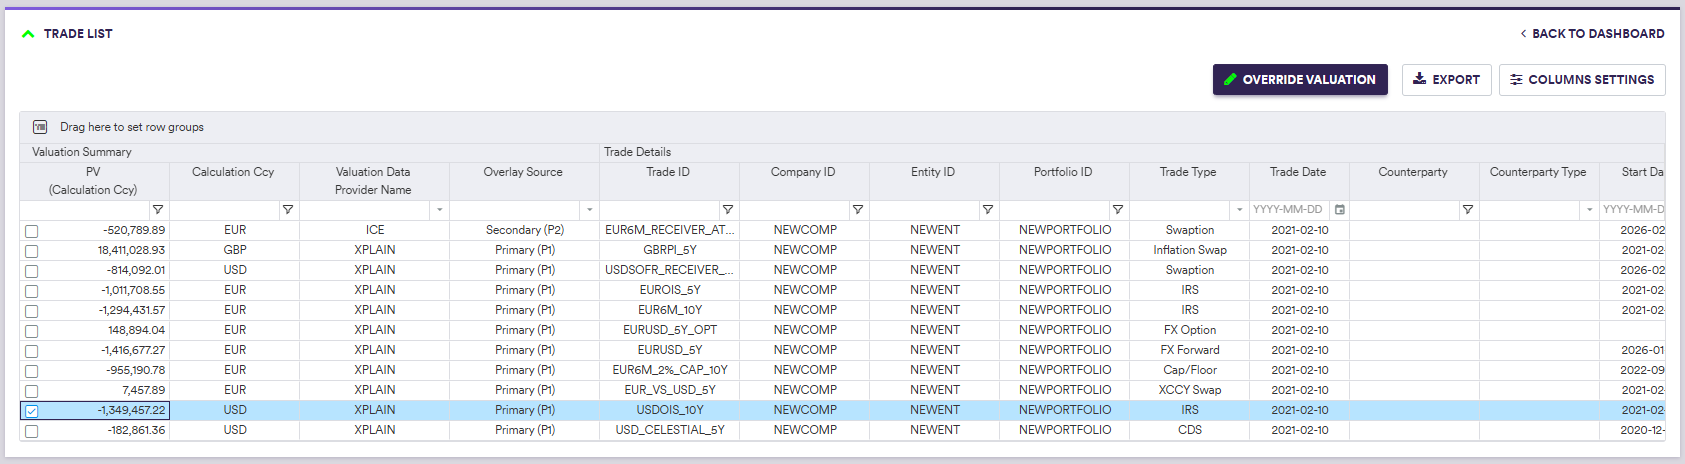
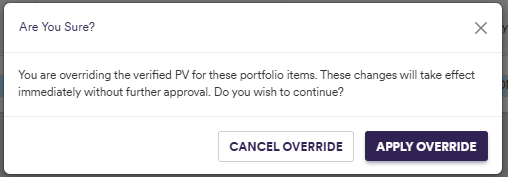
2. Overriding Valuation Data XM Results
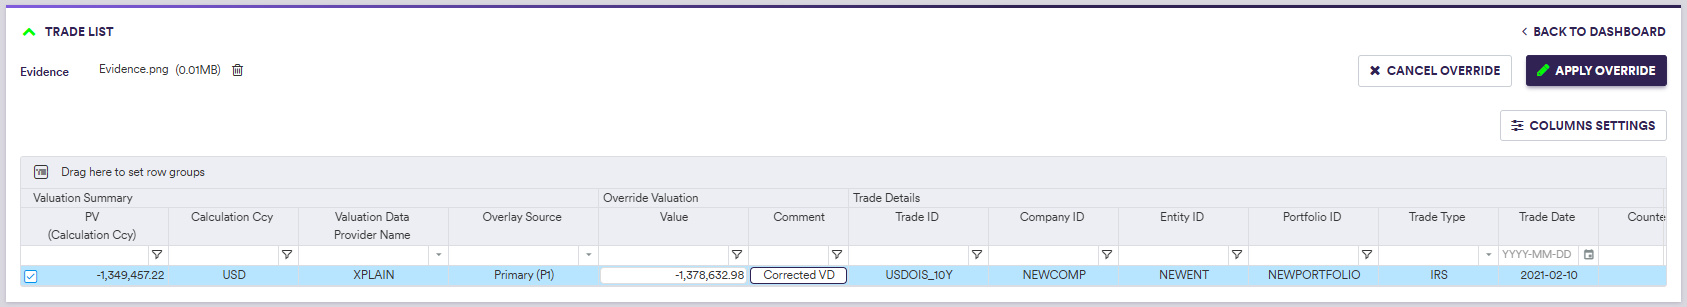
At the end of a valuation data XM workflow, you can manually override a valuation data, subject to evidence being uploaded, as it will impact the final reported numbers.
For the purpose of this example, a dummy evidence file can be downloaded here.
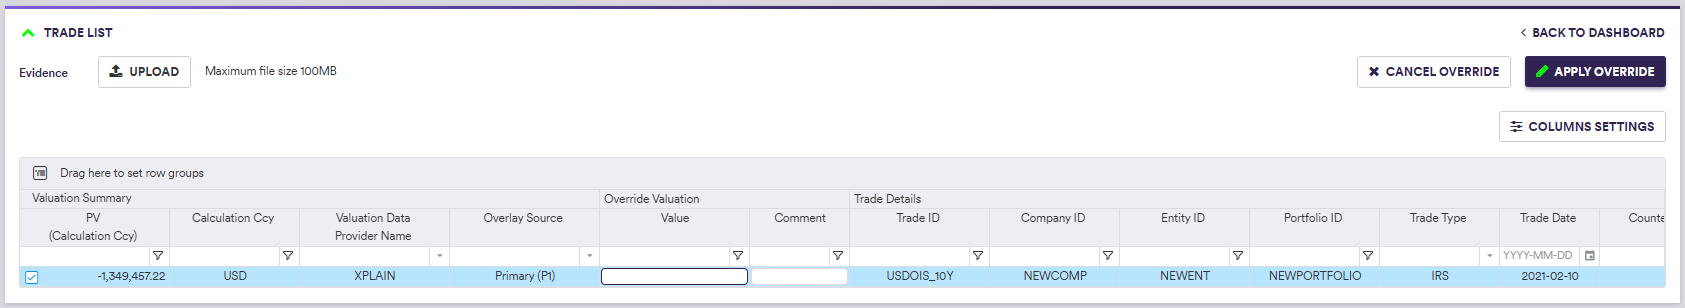
clicking on
3. Accessing Xplain PV Calculation Results
Where Xplain is one of the valuation data providers, you will be able to access the results of the valuations performed during the VD data cleansing workflow (Xplain PV calculation results), as described in PV Calculations - Run and Results.
4. Using MD Data Cleansing Results in Curve Calibrations
Once the data cleansing results from a MD or Combined Dashboard have been saved, you can choose to use the cleaned market data in a Curve Calibration, in both the PV Calculation Settings and Curve Calibration Parameters, by setting Market Data SOURCE to one of the four permissible values given in the table below.
Market Data Source Permissible Values
| MARKET DATA SOURCE | Description |
|---|---|
| Raw Primary | Use raw data from the primary market data provider (default) |
| Raw Secondary | Use raw data from the secondary market data provider |
| Preliminary Primary (*) | Use preliminary data for the primary market data provider |
| Preliminary Secondary (*) | Use preliminary data for the secondary market data provider |
| Overlay (*) | Use overlay data |