Once you have a pricing environment ready, you can perform valuations on a portfolio or on a trade basis, including PV, T0 cashflows and greeks (i.e. first-order sensitivity to various market data types).
Other pricing functionalities are listed here.
On this page, we will discuss how to:
- run the PV (and greeks) calculation process
- save, slice and dice PV calculation results
You can also compare PV calculation results for a given portfolio (e.g. day-on-day or using different valuation settings).
As your pricing environment, you can use the predefined ‘LONDON’ curve configuration, ‘RATES_DESK’ portfolio and ‘COB LONDON’ market data group. Alternatively, you can use the ‘NEW CURVE CONFIGURATION’ example, the ‘NEWPORTFOLIO’ example or the ‘NEW Market Data GROUP’ example that you may have defined.
This page will guide you through the process using an example: valuing the ‘NEWPORTFOLIO’ example as at 30 November 2022, using the ‘NEW CURVE CONFIGURATION’ example.
Running the PV Calculation Process
Under
The steps required to perform a portfolio valuation are as follows:
- set the valuation parameters
- apply curve shifts (optional) (e.g. to run scenario analysis or assess sensitivity to market data)
- start the calculation
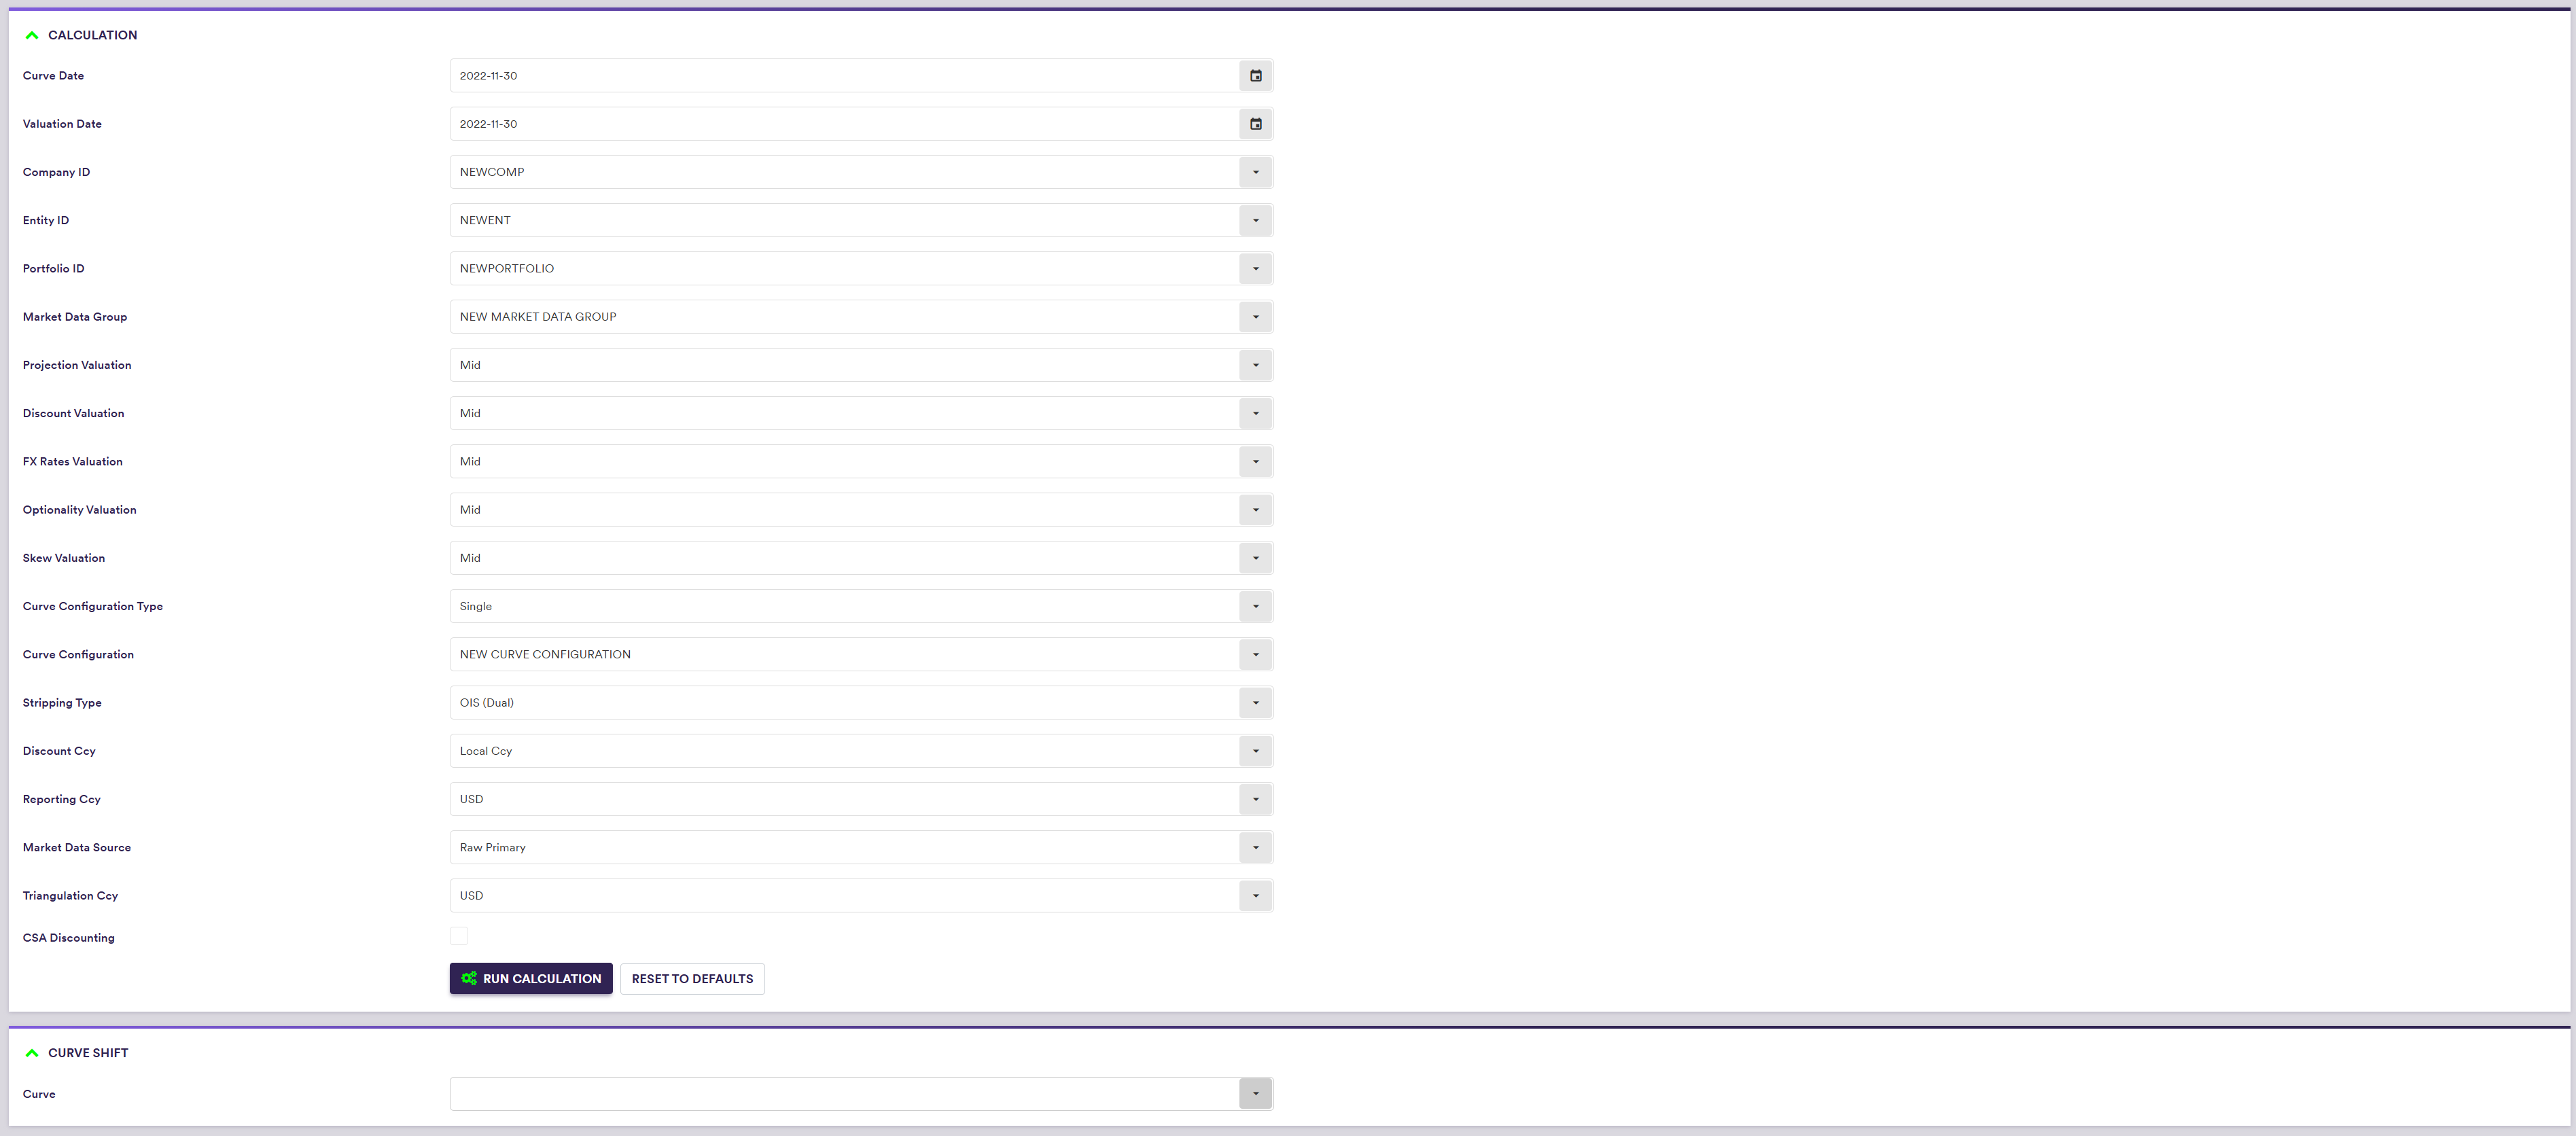
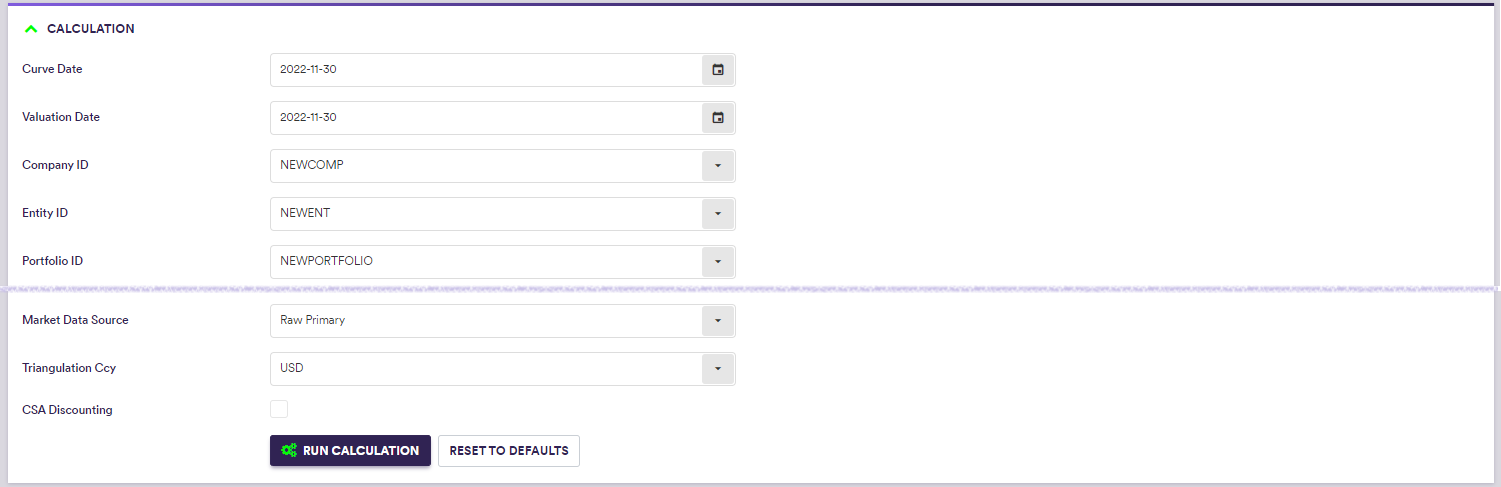
1. Setting Valuation Parameters
When accessing the PV calculation interface via the portfolio to be valued, valuation parameters are automatically filled with the default values associated with the parent company (or entity), but you can subsequently override them.
Once you have defined the valuation parameters and the curve shifts (if any), you can start the valuation process.
| Field Name | Description | Permissible Values |
|---|---|---|
| Curve Date | The market data’s historical curve date (default = system date) | YYYY-MM-DD (ISO 8601) |
| Valuation Date | The valuation date (default = Curve Date) | YYYY-MM-DD (ISO 8601) |
| Company ID | Company -> Entity -> Portfolio | Any existing Company ID |
| Entity ID | Company -> Entity -> Portfolio | Any existing Entity ID |
| Portfolio ID | Company -> Entity -> Portfolio | Any existing Portfolio ID |
| Market Data Group | The market data group that contains the raw market data | See market data |
| Projection Valuation | Market data side for projection curves | Bid | Mid | Ask |
| Discount Valuation | Market data side for discounting curves | Bid | Mid | Ask |
| FX Rates Valuation | Market data side for FX rates | Bid | Mid | Ask |
| Optionality Valuation | Market data side for ATM swaption and FX volatilities | Bid | Mid | Ask |
| Skew Valuation | Market data side for Swaption and FX volatility skews | Bid | Mid | Ask |
| Curve Configuration Type | If Curve Configuration Type = “FX vs non-FX Instruments”, a different Curve Configuration will apply for FX vs non-FX trades |
Single FX vs non-FX Instruments |
| Curve Configuration | The applicable curve configuration(s) | See curve configuration |
| Stripping Type |
Dual stripping (for the projection and discount curves) or Single curve stripping See here. | OIS (DUAL) | SINGLE |
| Discount Ccy |
Applicable single currency for discounting purposes or If Discount Ccy = 'Local Ccy', the discount currency will be a function of the trade type and user parameterisation (see here) |
Any permissible discount currency Local Ccy |
| Reporting Ccy | The currency in which the calculation results are expressed | Any permissible currency |
| Market Data Source |
Data type (raw, preliminary cleansed or overlay) + Data provider (primary or secondary) |
RAW | PRELIMINARY | OVERLAY PRIMARY | SECONDARY See using MD exception management results |
| Triangulation Ccy | The triangulation currency used first when no direct base vs counter curve can be found for foreign cashflow discounting | Any permissible discount currency |
| CSA Discounting | Whether to apply a specific CSA Discount Currency when specified at trade level (see here) | Boolean |
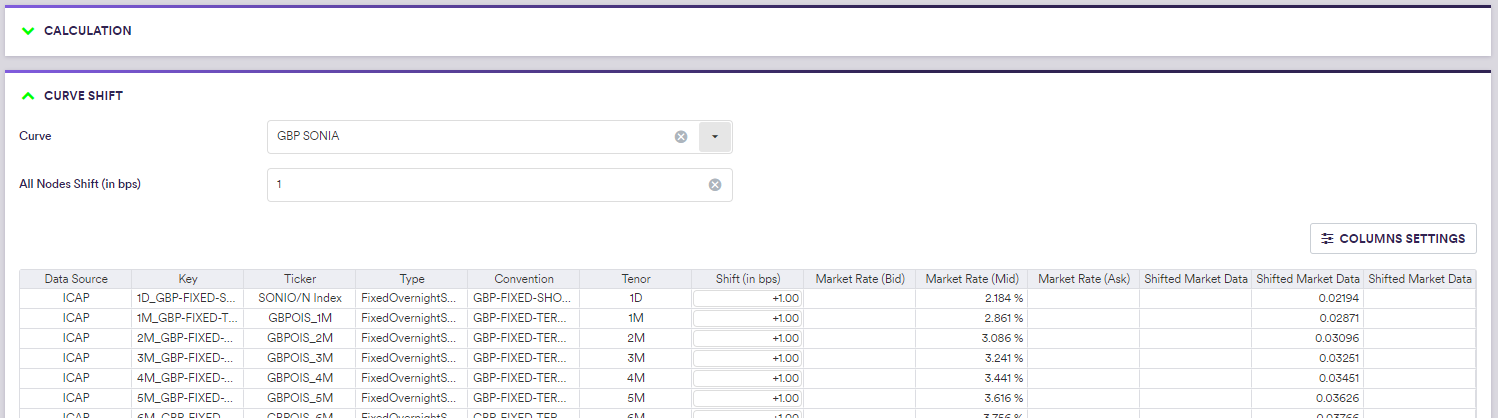
2. Applying Curve Shifts
To run scenario analysis or assess sensitivity to market data, you can perturb market rates, either by applying a parallel shift or a shift on a node basis.
Once you have defined the valuation parameters and the curve shifts (if any), you can start the valuation process.
A description of the curve shift parameterisation and corresponding permissible values are set out in the table below.
| Field Name | Description | Permissible Values |
|---|---|---|
| Curve | A curve that belongs to the selected curve configuration | See curve build and calibration |
| All Nodes Shift (in bps) | The parallel upwards shift, expressed in basis points (bp) | Numeric (e.g. 1 for 1bp) |
| Shift (in bps) | The node upwards shift, expressed in basis points | Numeric (e.g. 1 for 1bp) |
3. Starting the PV Calculation Process
Once you have defined the valuation parameters and the curve shifts (if any), you can start the valuation process by clicking on
This will automatically lead you to the PV calculation results page.
PV Calculation Results
Once the valuation process has been completed, you will automatically be redirected to the “PV Calculation Results” window, which contains saved calculation results, as well as the latest calculation results for a given portfolio (or trade).
Valuation results can also be accessed under
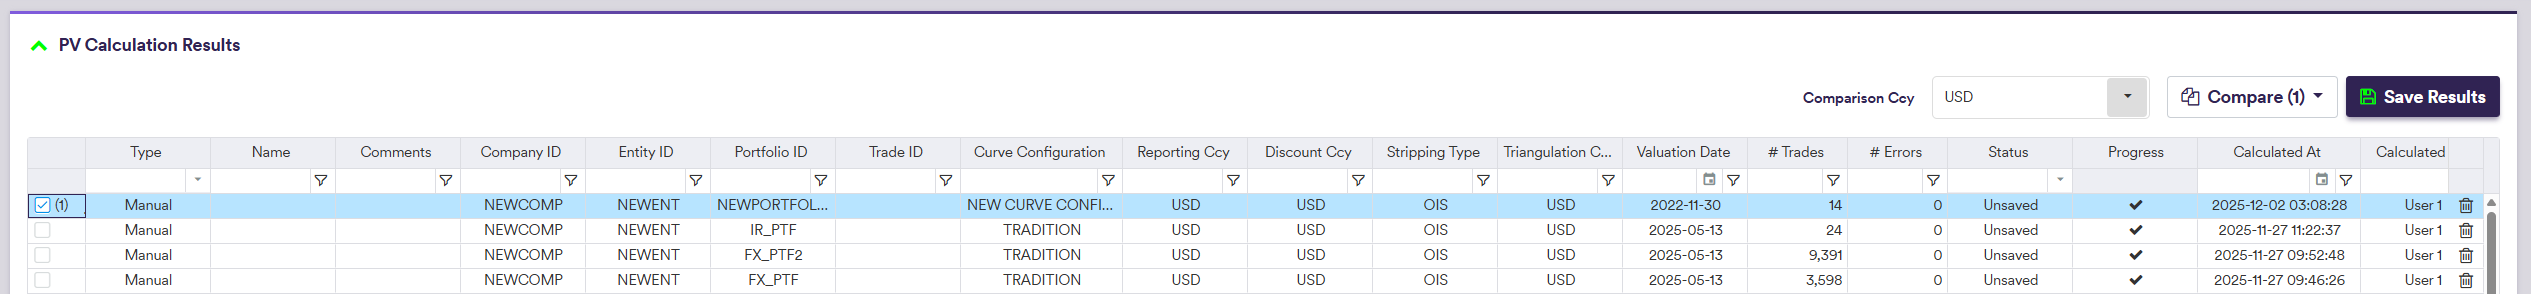
The list of calculation results will always comprise the latest valuation performed on a given portfolio (or trade), which will override any unsaved valuation.
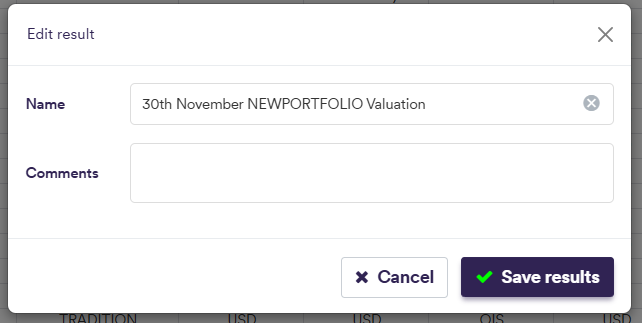
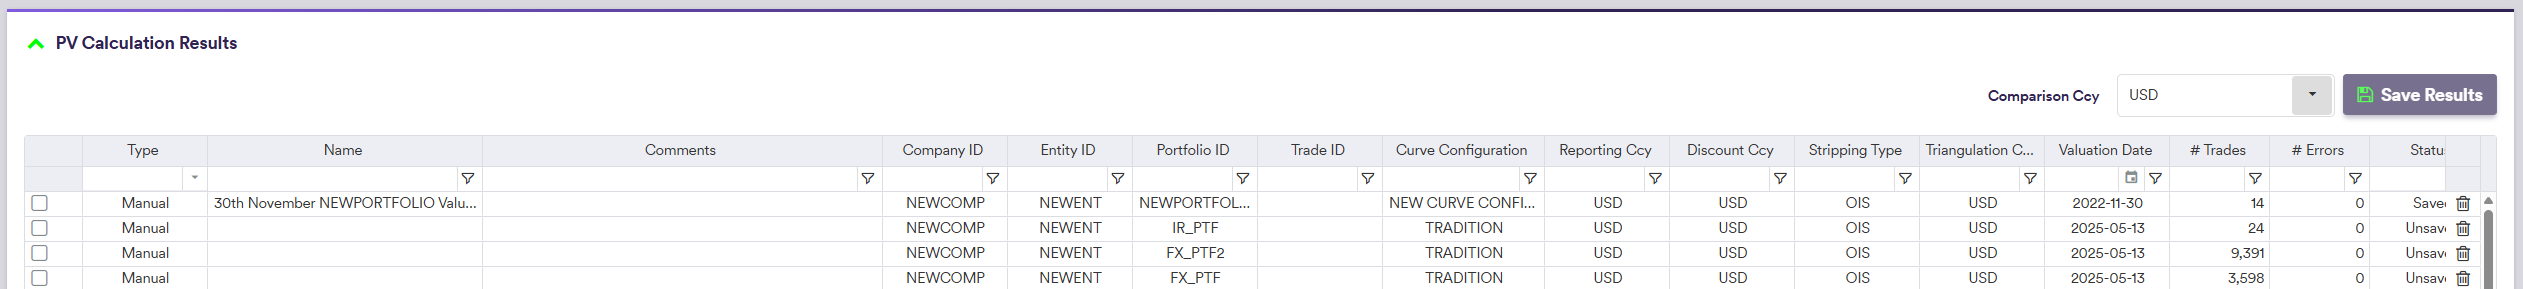
Saving a Calculation Result
You can save a calculation result after selecting it and clicking on
Once a valuation is saved, the valuation date and PV of each trade are added to their valuation history, which can be viewed at the trade level.
You can also compare PV calculation results for a given portfolio (e.g. day-on-day or using different valuation settings).
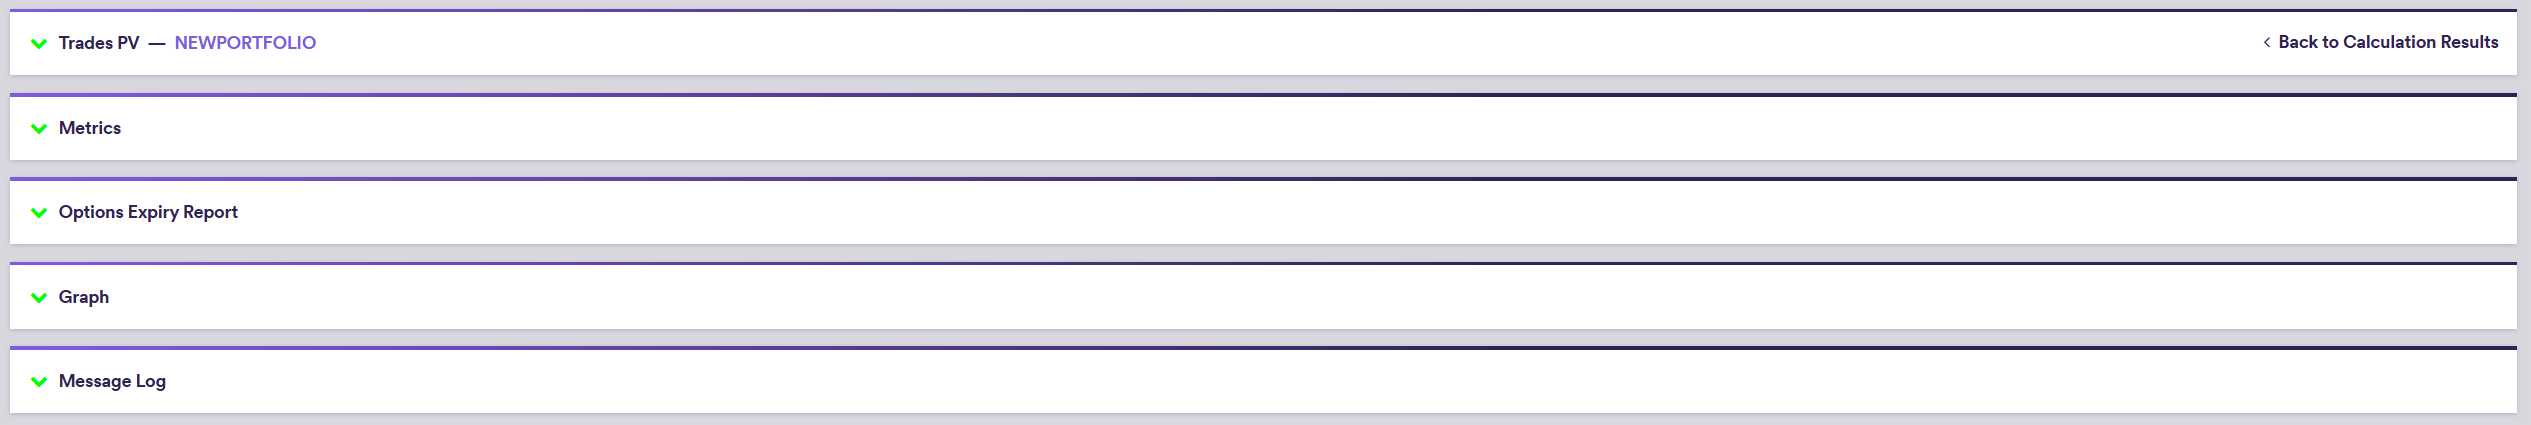
At the calculation results level (by double-clicking on the line item), the various output windows are as follows:
- PV, T0 cashflows and greeks on a trade basis
- Portfolio metrics, including aggregated cashflows, bucketed greeks and net currency exposure calculations for the portfolio (or selected trades)
- Option expiry heatmaps for swaptions and FX options for the portfolio (or selected trades)
- Graphs of calibrated curves that were used during the valuation process
- Message log of events that were recorded during the valuation process
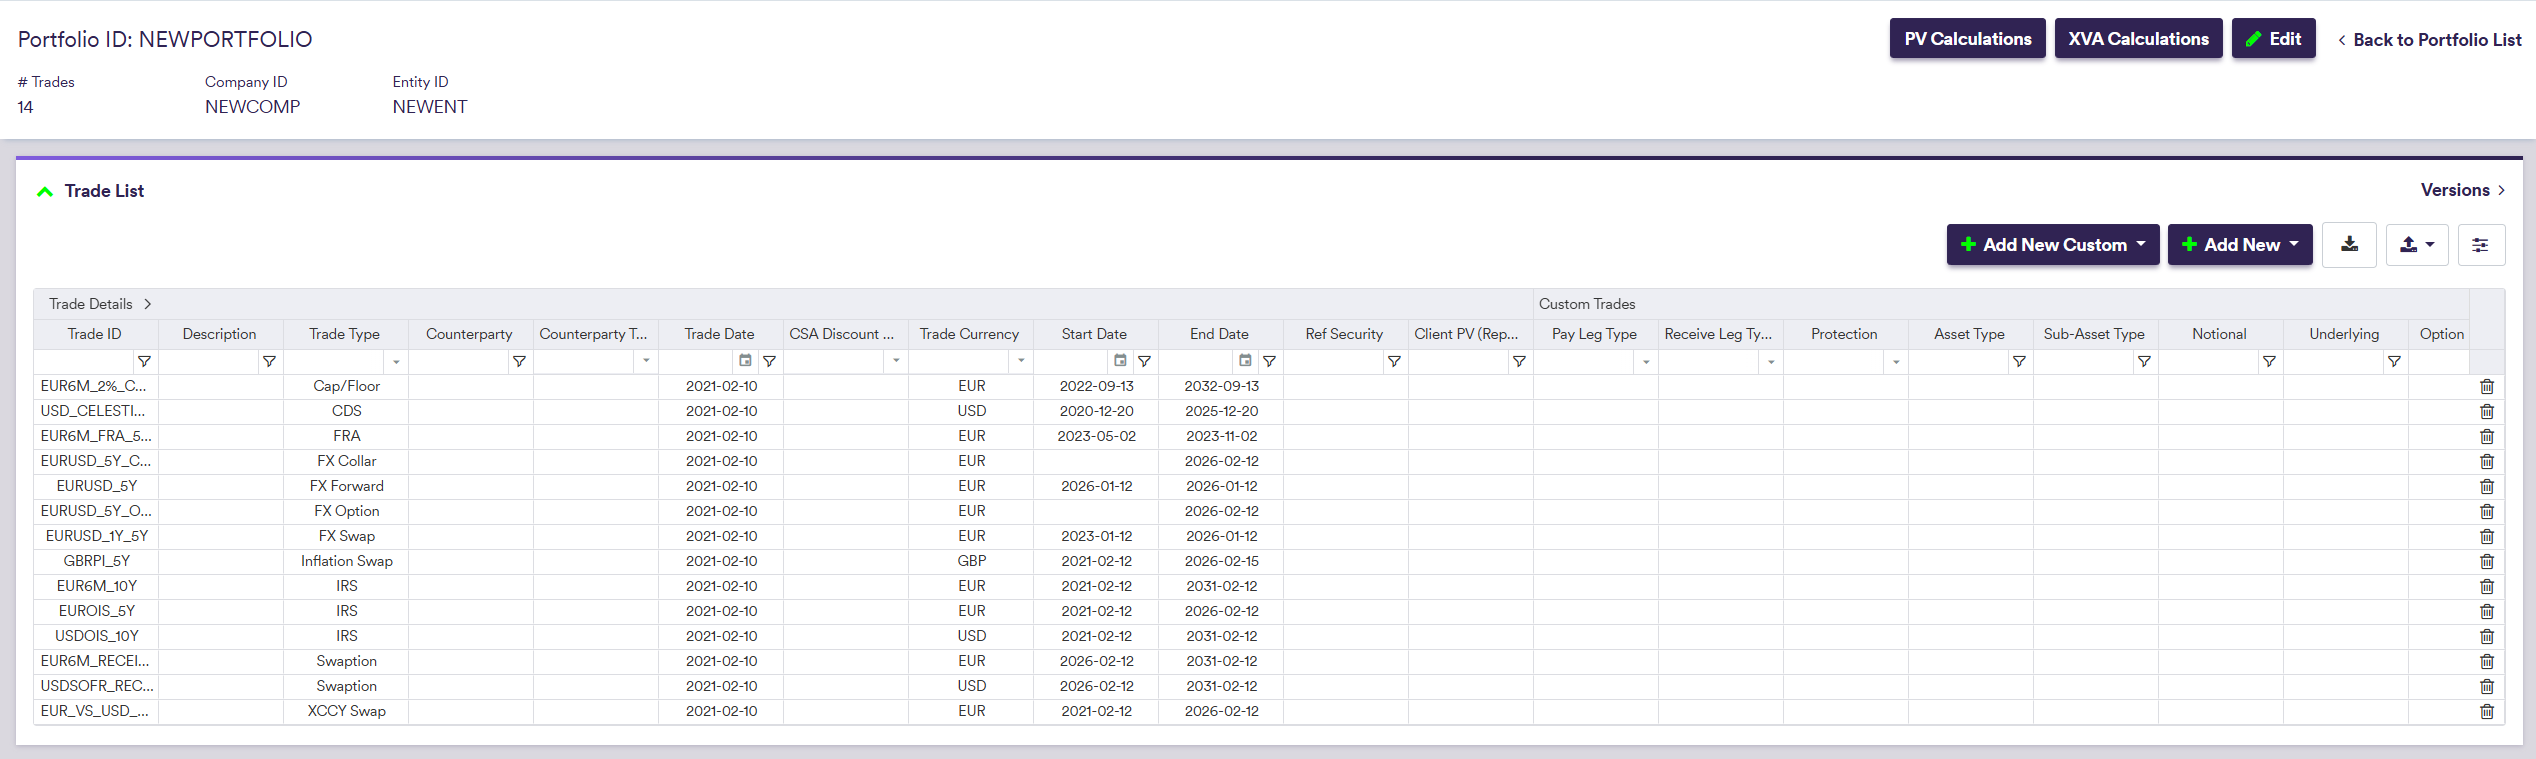
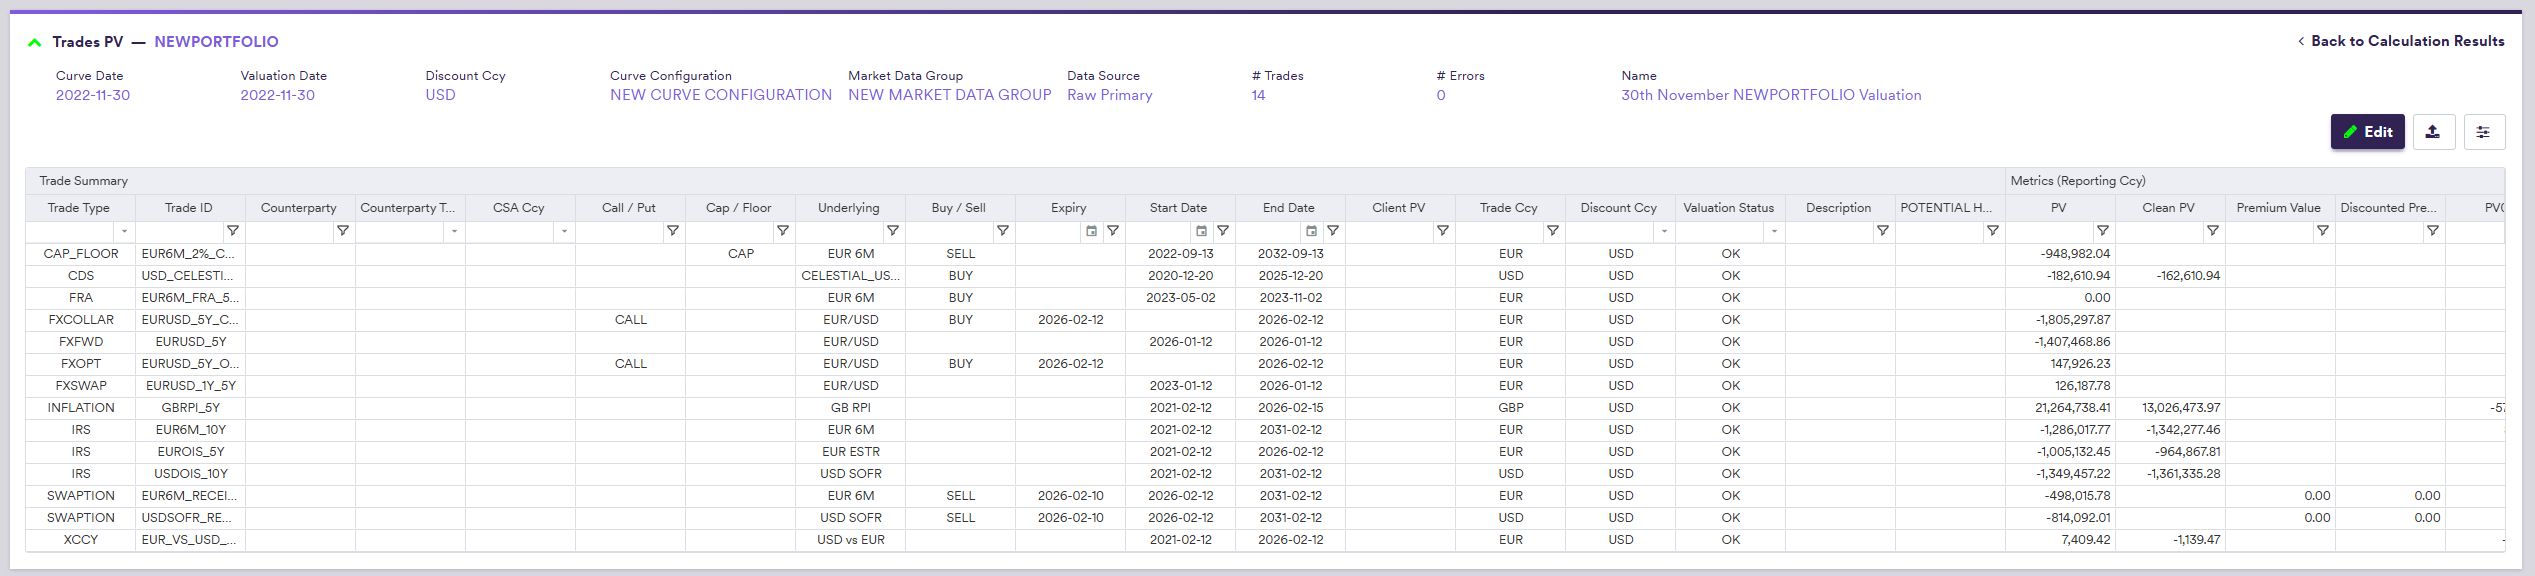
1. Results on a Trade Basis
In the “TRADES PV” window, you can view, filter and export valuation results on a trade basis. By double-clicking on the line item, you can view the full trade details.
Other valuations outputs are available.
| CATEGORY | UI Field Name | Description / PERMISSIBLE VALUE |
|---|---|---|
| Trade Summary | Trade Type |
CAP_FLOOR | CDS | CREDIT_INDEX | CREDIT_INDEX_TRANCHE FXFWD | FXOPT | INFLATION | IRS | LOAN_NOTES SWAPTION | XCCY | any custom trade type |
| Trade Summary | Trade ID | Unique trade identifier |
| Trade Summary | Counterparty | Counterparty identifier |
| Trade Summary | Counterparty Type | CLEARED | BILATERAL |
| Trade Summary | CSA Ccy | The discount currency that was applied (if any) if CSA Discounting is set to TRUE at valuation level |
| Trade Summary | Call / Put | Call or Put |
| Trade Summary | Cap / Floor | Cap or Floor |
| Trade Summary | Underlying | The trade's underlying |
| Trade Summary | Buy/Sell | Optionality or credit protection direction (where applicable) |
| Trade Summary | Expiry | Option's expiry date (where applicable) |
| Trade Summary | Start Date | Start date |
| Trade Summary | End Date | End date |
| Trade Summary | Client PV | Client PV |
| Trade Summary | Trade Ccy | The currency in which the trade metrics are expressed |
| Trade Summary | Discount Ccy | The applied discount currency |
| Trade Summary | Valuation Status | OK | ERROR (hover to see error type) |
| Metrics (Reporting Ccy / Trade Ccy) | PV | Dirty PV |
| Metrics (Reporting Ccy / Trade Ccy) | Clean PV | Clean PV |
| Metrics (Reporting Ccy / Trade Ccy) | PV01 | PV sensitivity to 1bp change in the fixed rate |
| Metrics (Reporting Ccy / Trade Ccy) | Total DV01 | Total PV sensitivity to 1bp change in interest rate |
| Metrics (Reporting Ccy / Trade Ccy) | INF01 / CS01 / BR01 | PV sensitivity to 1bp change in inflation / credit / basis |
| Metrics (Reporting Ccy / Trade Ccy) | Delta (Fwd) | FX delta, expressed in forward amount |
| Metrics (Reporting Ccy / Trade Ccy) | Delta (Spot) | FX delta, expressed in spot amount |
| Metrics (Reporting Ccy / Trade Ccy) | Gamma | DV01 sensitivity to 1bp change in interest rate |
| Metrics (Reporting Ccy / Trade Ccy) | Theta | PV sensitivity to 1 day decay |
| Metrics (Reporting Ccy / Trade Ccy) | Vega | PV sensitivity to 1bp (1%) change in the normal (lognormal) volatility |
| Metrics (Reporting Ccy / Trade Ccy) | T0 Net CFS | T0 net cashflows |
| Metrics (Reporting Ccy / Trade Ccy) | Accrued | The amount of accrued interest |
| Breakeven Metrics | Par Rate, % | Par rate |
| Breakeven Metrics | Implied Vol, bps | Implied volatility, expressed in basis points |
| FX Options | Strike | The FX Option Strike |
| FX Options | Underlying FX Rate | The FX Rate for the underlying |
| Inflation | Initial Index | The initial index |
| Inflation | Final Index | The final index |
| Loan Note | Bond Coupon, % | The bond coupon |
| Loan Note | Credit Spread, % | The credit spread |
| Loan Note | YTM (Gvt), % | The yield to maturity (Government) |
| Loan Note | YTM (Bond), % | The yield to maturity (Bond) |
| Loan Note | Clean Price, % | The clean price |
| Loan Note | Accrued (Price), % | The accrued Price |
| Loan Note | Duration | The duration |
| Loan Note | Modified Duration | The modified duration |
| Pay Leg / Rec Leg | Ccy | Leg currency |
| Pay Leg / Rec Leg | Notional | Leg notional |
| Pay Leg / Rec Leg | Rate/Margin, % | Leg fixed rate or margin, expressed in % |
| Pay Leg / Rec Leg | Index | Leg index |
| Pay Leg / Rec Leg | Freq | Leg frequency |
| Pay Leg / Rec Leg | Day Count | Leg daycount |
| Pay Leg / Rec Leg | T0 CFS | Leg T0 cashflow |
| Pay Leg / Rec Leg | PV | Leg dirty PV (in leg currency) |
| Pay Leg / Rec Leg | Accrued | The amount of accrued interest |
| Pay Leg / Rec Leg | Accrued Days | The number of days used in the calculation of accrued interest |
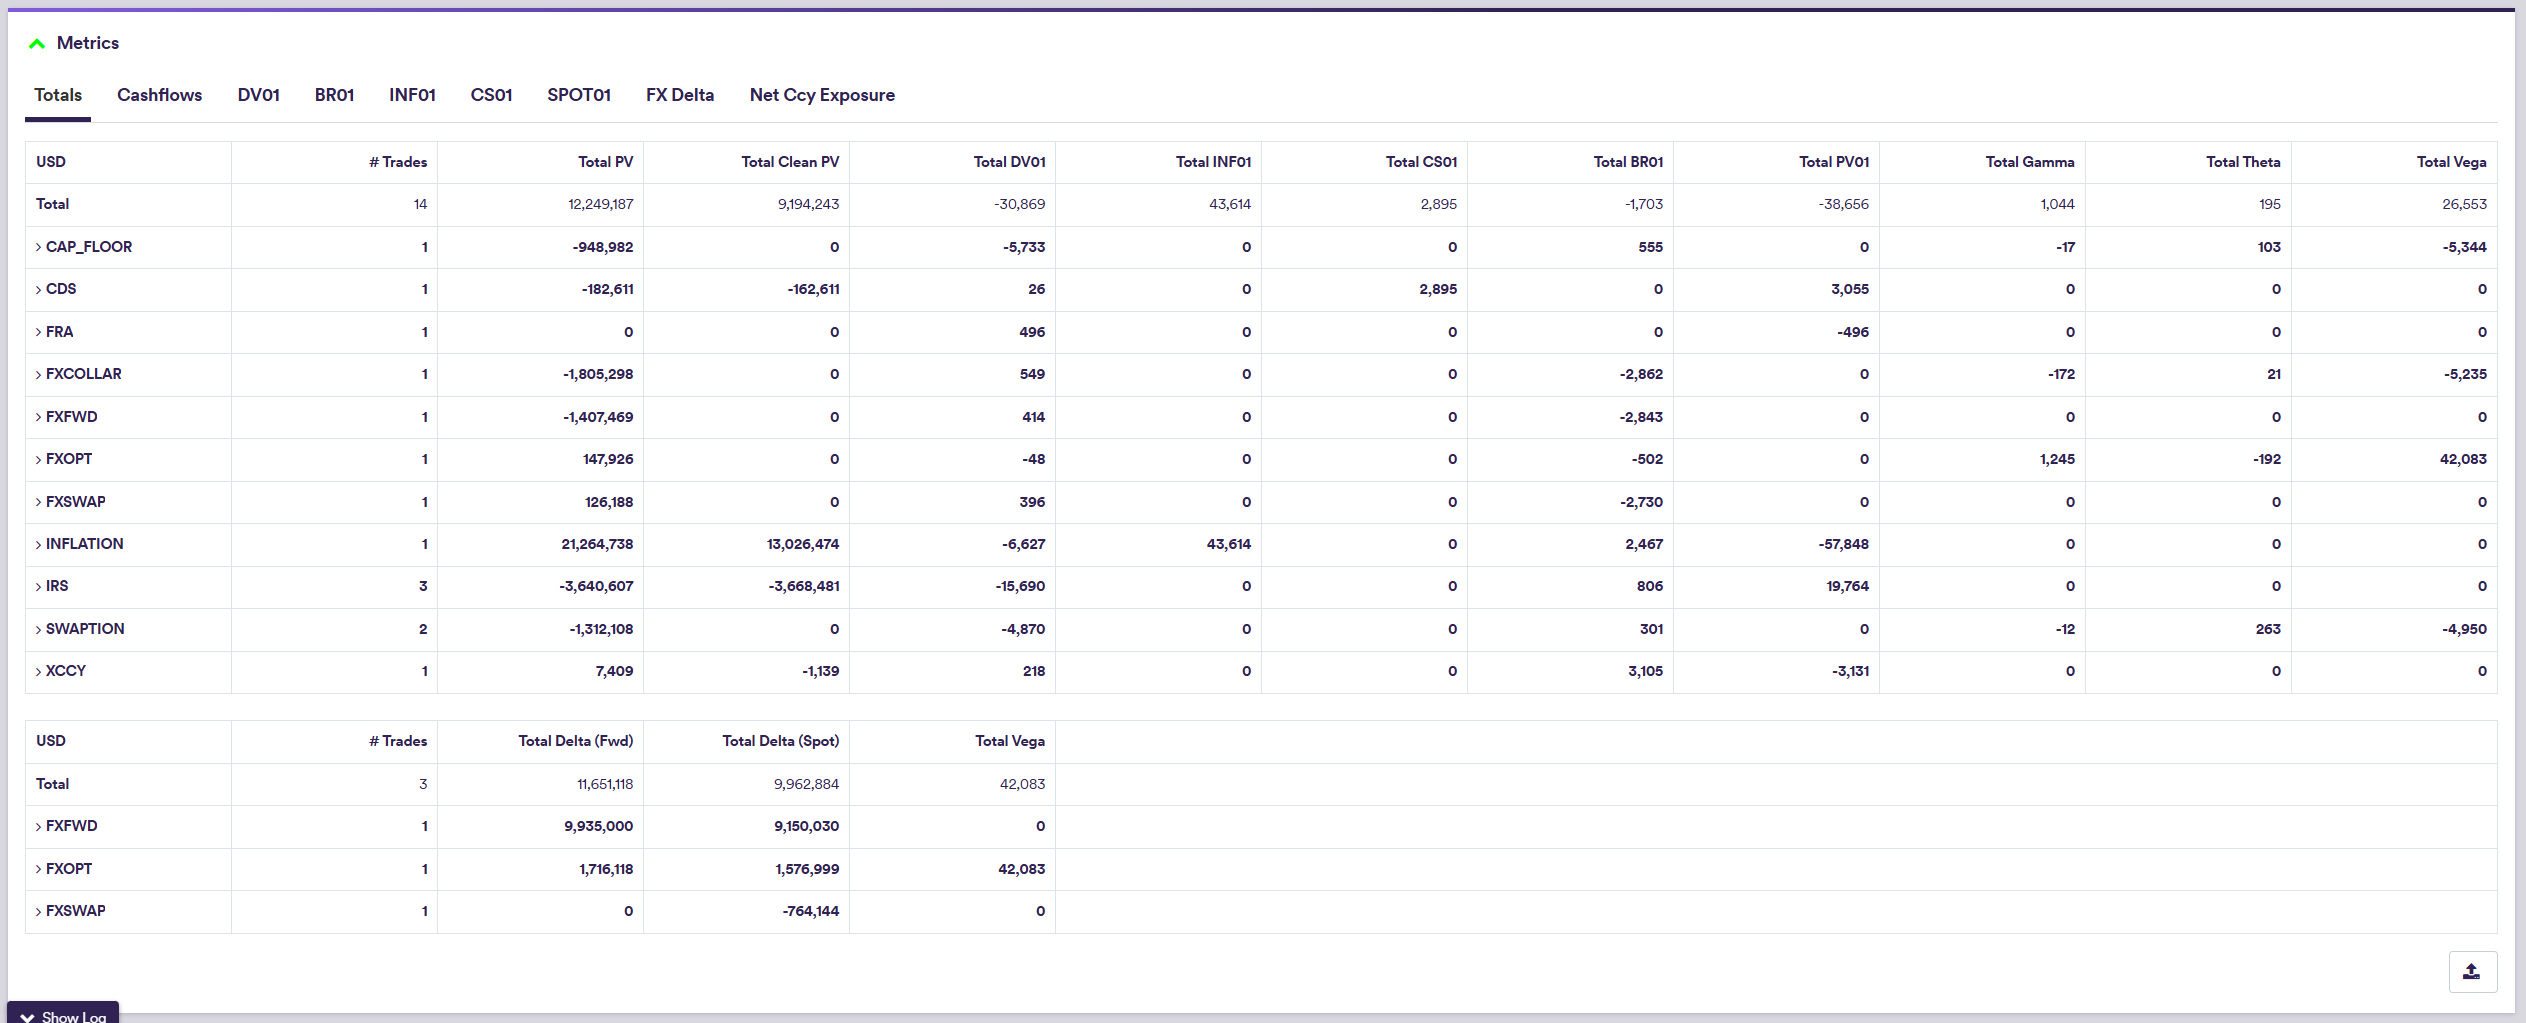
2. Results on a Portfolio Basis
In the “METRICS” window, you can view and export aggregated valuation results for the portfolio (or on selected trades). The valuation results will be split by product type and underlyings.
Other valuations outputs are available.
| Tab Name | Description | Additional Information |
|---|---|---|
| Totals | Total # Trades, dirty PV, clean PV, DV01, INF01, CS01, BR01, PV01, Gamma, Theta, Vega, expressed in the reporting currency (see definitions above) | Per trade type / underlying |
| Cashflows | Aggregated pay / receive leg cashflows (forecast), expressed in the leg currency | Per currency |
| Cashflows | Aggregated pay / receive cashflows (discounted), expressed in the leg currency | Per currency |
| Cashflows | Aggregated net cashflows (discounted), expressed in the reporting currency | Per currency |
| Cashflows | Discount Ccy / The currency used for the purpose of expressing the valuation metrics | See here for permissible values |
| Cashflows | DF | Per currency |
| DV01 | Bucketed PV sensitivity to 1bp change in interest rate, expressed in the local currency | Per curve |
| BR01 | Bucketed PV sensitivity to 1bp change in basis spread, expressed in the local currency | Per curve |
| INF01 | Bucketed PV sensitivity to 1bp change in inflation rate, expressed in the local currency | Per curve |
| CS01 | Bucketed PV sensitivity to 1bp change in credit spread, expressed in the local currency | Per selected curves |
| SPOT01 | PV sensitivity to 1bp change in the spot rate, expressed in the base currency | Per FX pair |
| FX Delta | Bucketed FX delta, expressed in spot/forward amount of the base currency | Per selected FX delta type (Fwd or Spot) |
| Net Ccy Exposure | Net currency exposure, expressed as the aggregate (delta adjusted) FX forward and FX option notionals and currency exposure related to a given currency | See here |
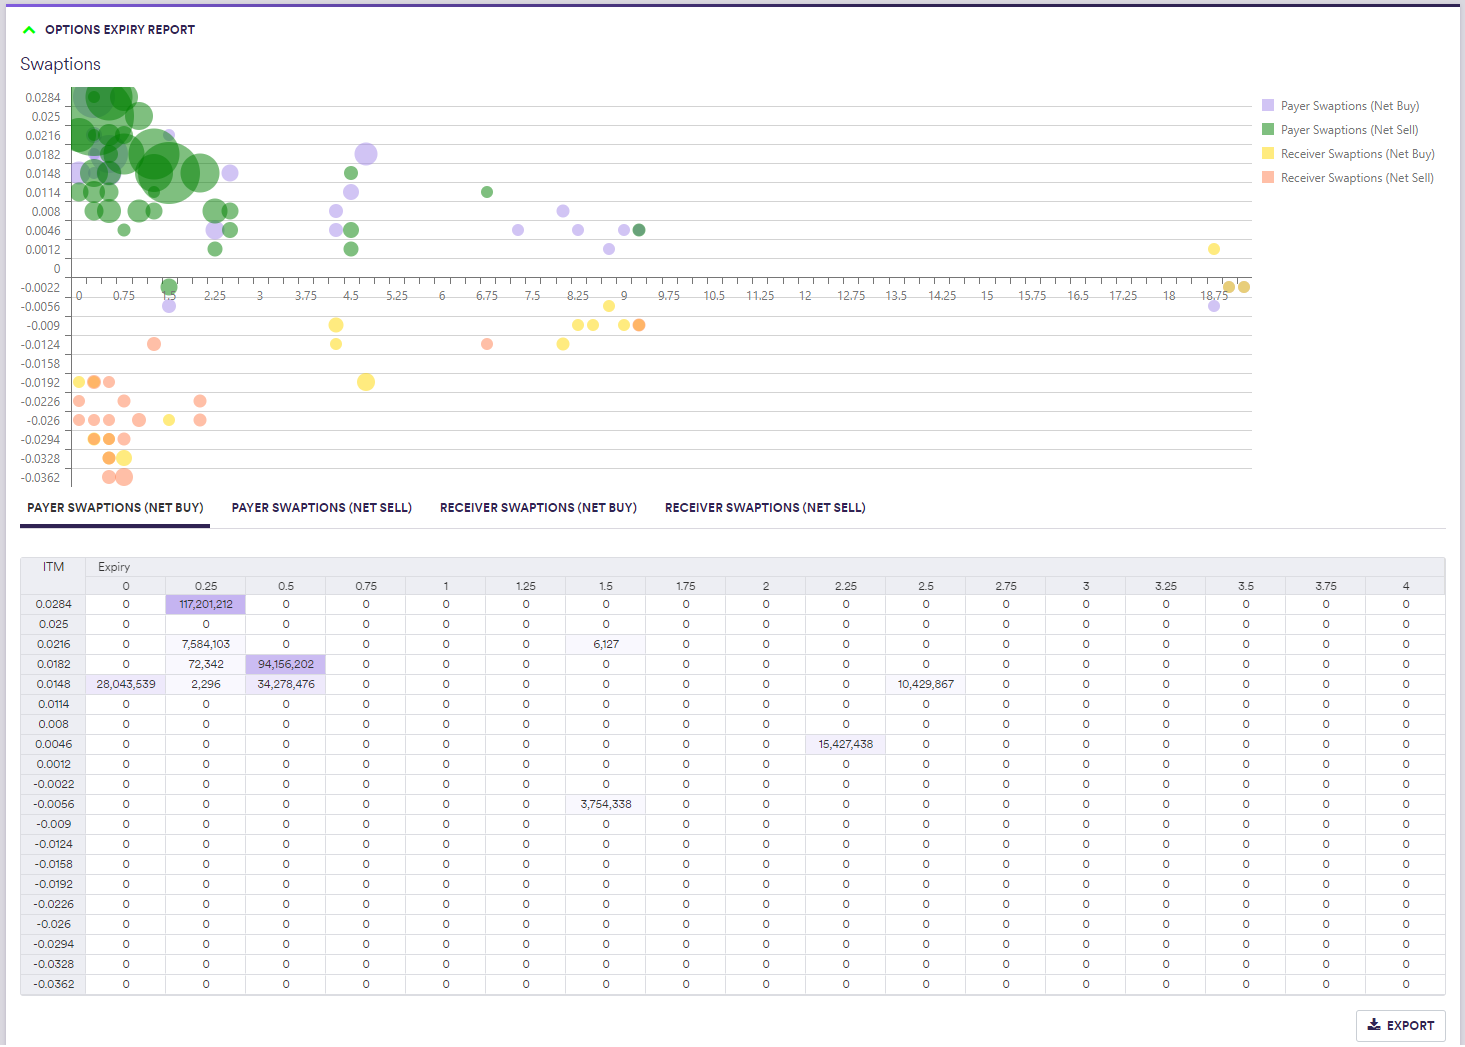
3. Option Expiry Heatmap
In the “OPTION EXPIRY REPORT” window, you can view and export option expiry heatmaps for the portfolio (or on selected trades). You can select the option type to be displayed using the interactive legend.
Other valuations outputs are available.
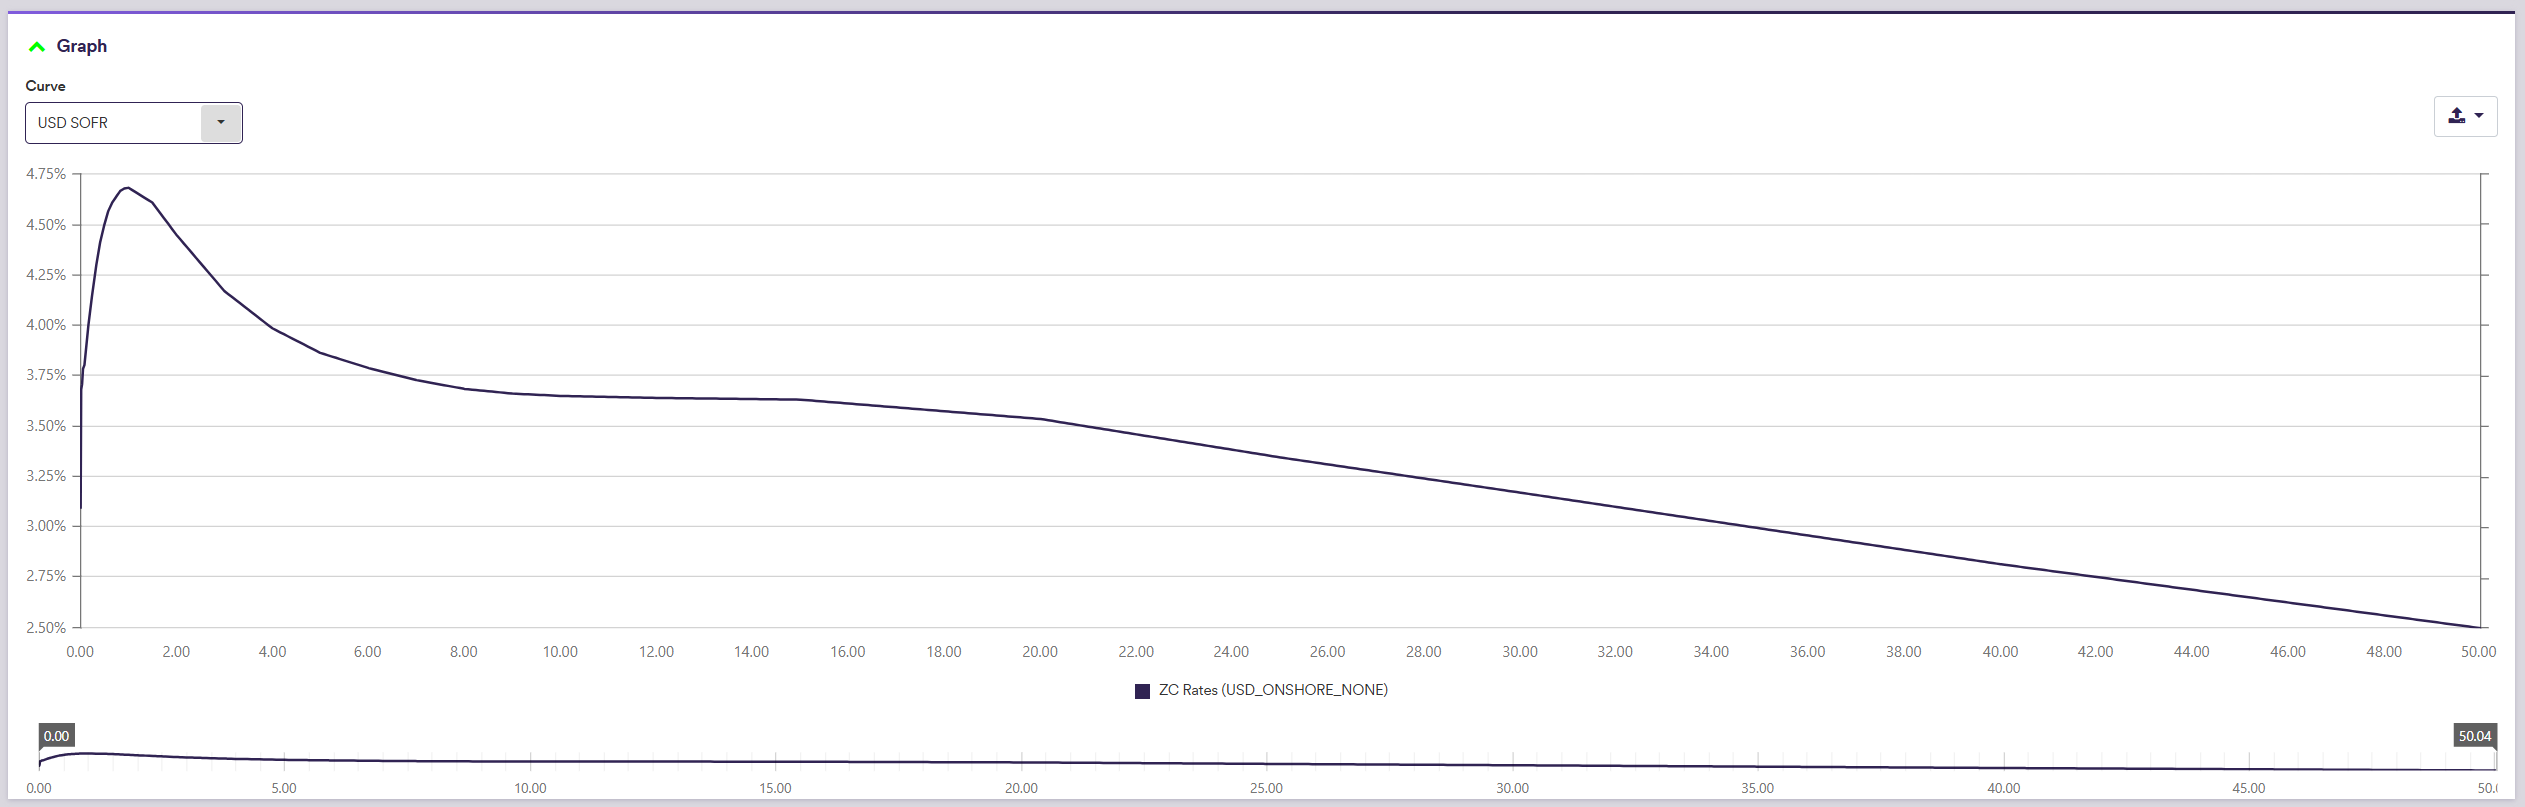
4. Curve Graphs
In the “GRAPHS” window, you can plot the graphs of the calibrated curves that were used in the valuation process.
Other valuations outputs are available.
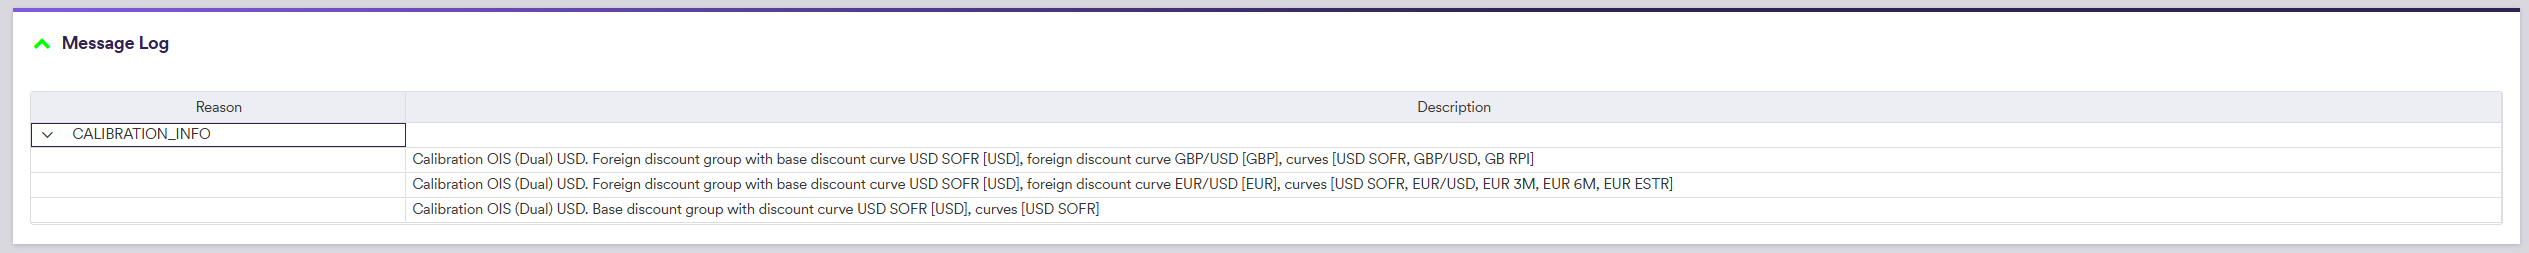
5. Message Log
Events (including warning or errors) logged during the valuation process will be set out in the “MESSAGE LOG” window.
Other valuations outputs are available.