Under
- run the XVA calculation process (and exposures, if applicable)
- save, slice and dice PV and XVA calculation results
- compare saved PV calculation results for a given portfolio (e.g. day-on-day or using different valuation settings) (see Valuations)
Running XVA Calculations
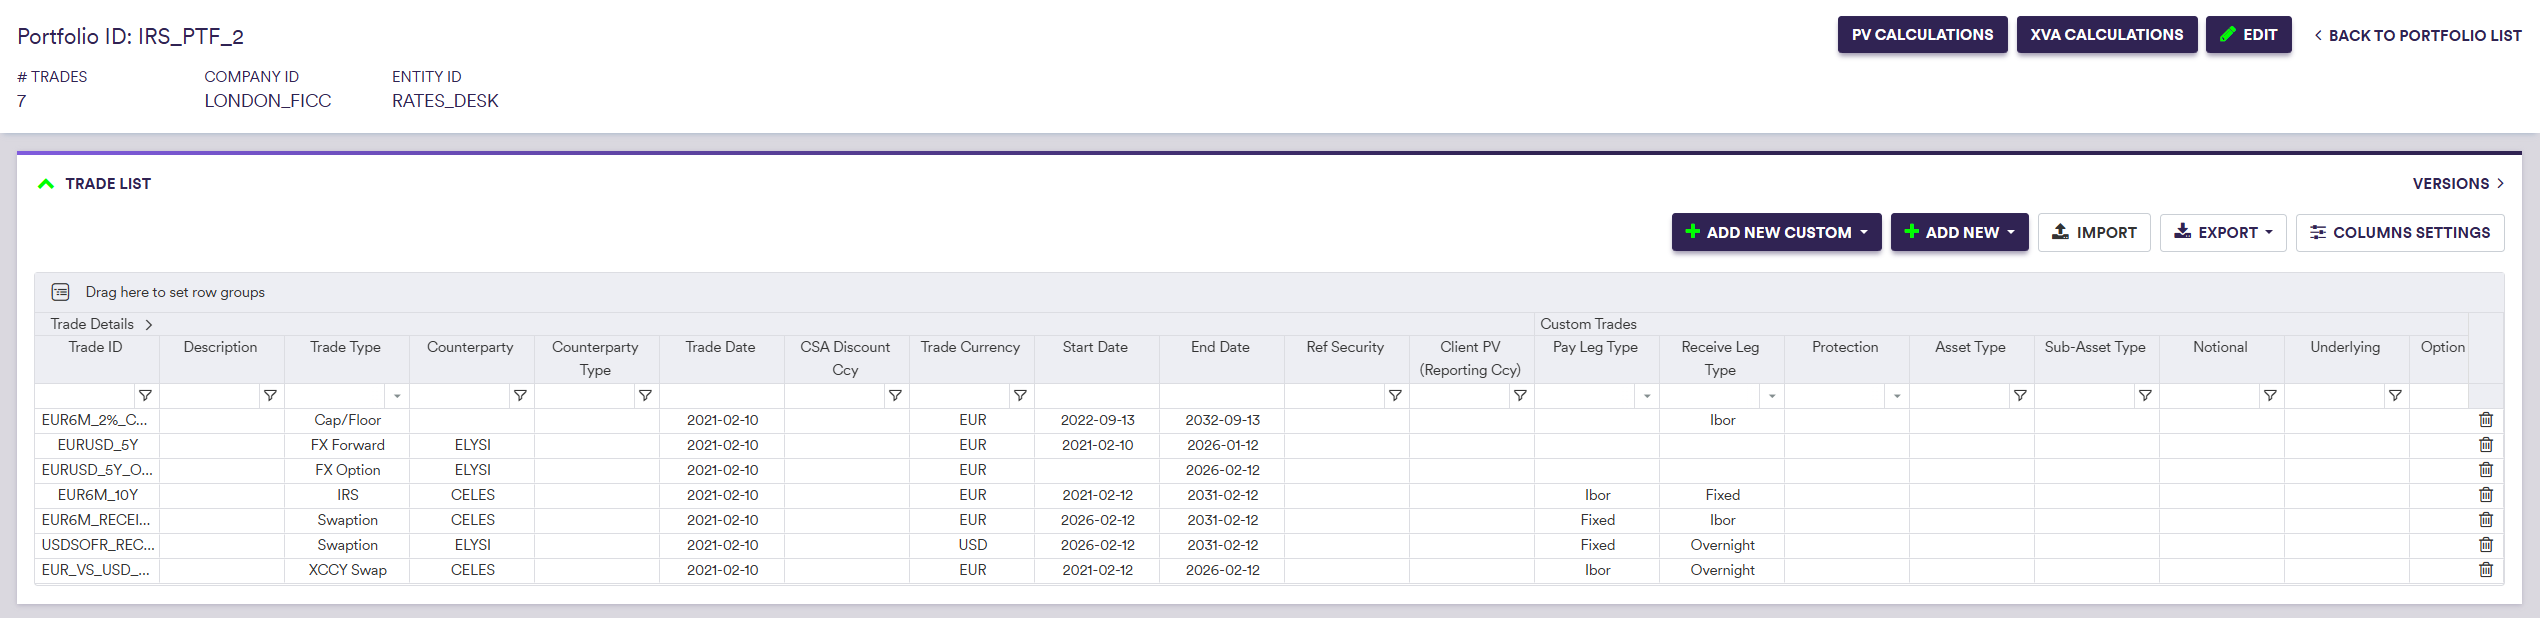
Once you have added relevant funding nodes, defined a curve configuration, a market data environment, a portfolio, the applicable valuation settings and the XVA model parameterisation, the XVA calculation interface can be accessed i) at the portfolio level under
Prior to valuing a portfolio and performing XVA calculations, you will need to:
- set the valuation parameters (see Valuations)
- apply curve shifts, if any (see Valuations)
- set the XVA calculation parameters
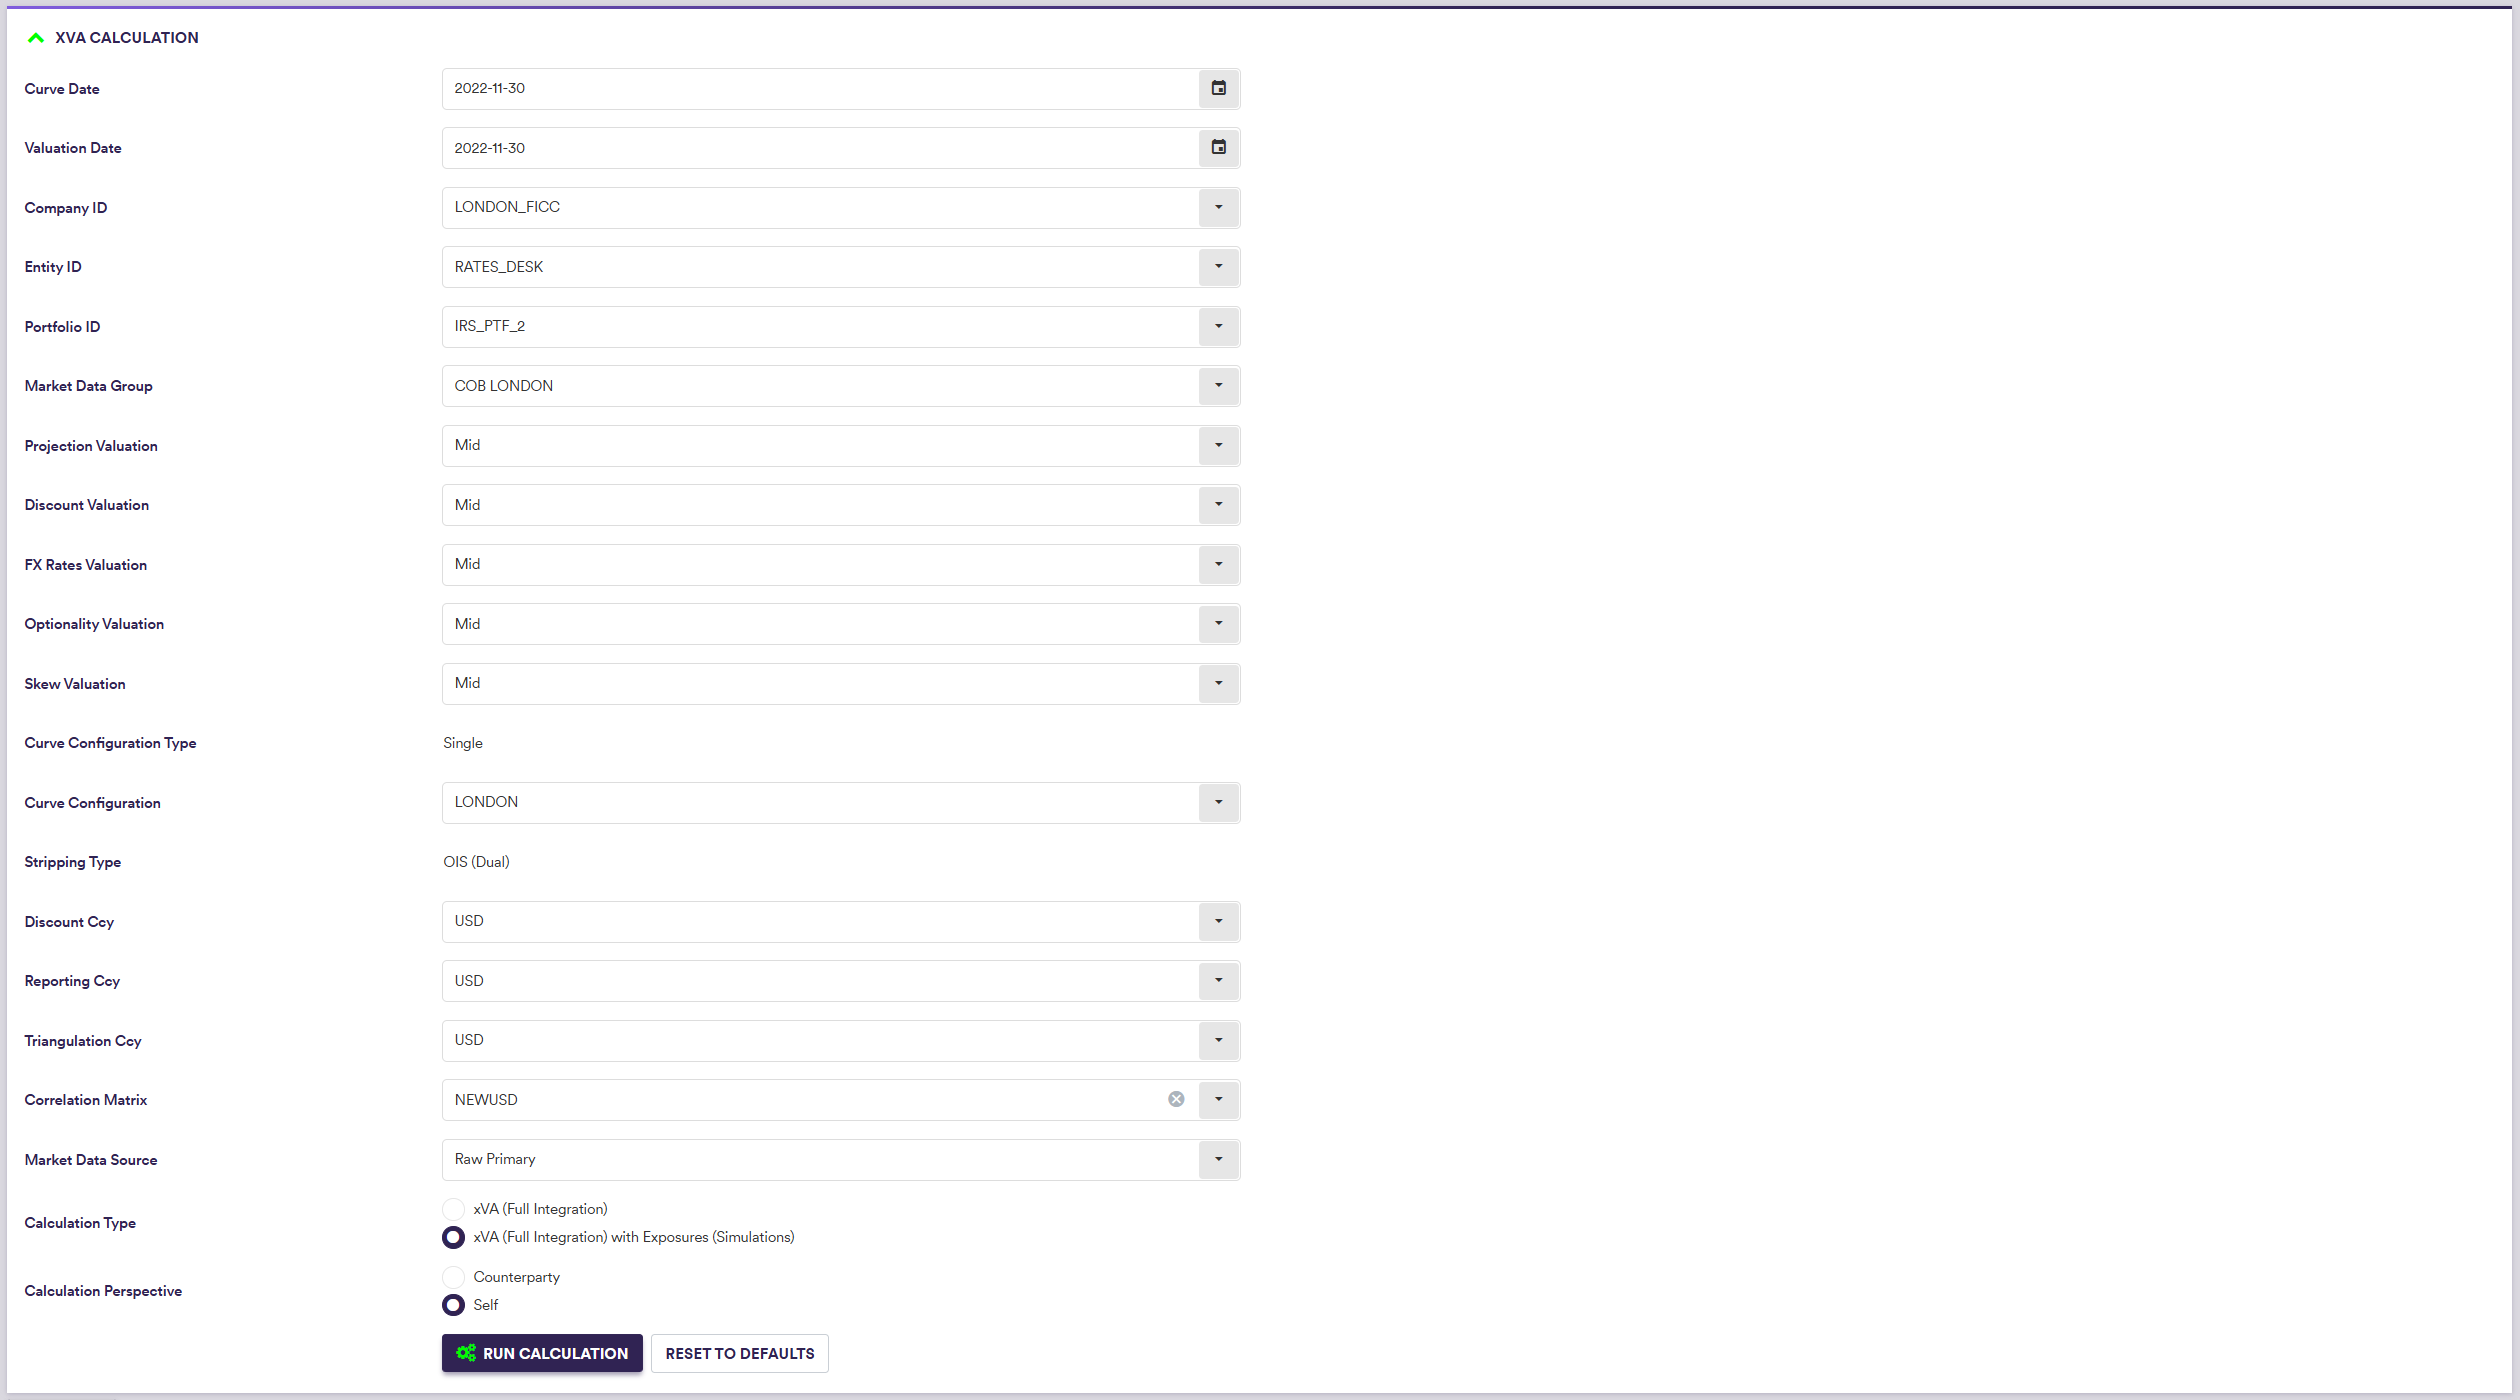
A description of the settings specific to XVA calculations and corresponding permissible values are set out in the table below.
| Field Name | Description | Permissible Values |
|---|---|---|
| Correlation Matrix | The matrix of correlations between underlying IR rates and FX rates | See correlation matrices |
| Calculation Type | XVA calculations only or with simulated underlying exposure calculations |
xVA (Full Integration) xVA (Full Integration) with Exposures (Simulations) |
| Calculation Perspective | XVA calculations can be performed from the standard or the counterparty's perspective | Counterparty | Self |
XVA Calculation Results
Once a portfolio (and XVA) has been valued (after clicking on

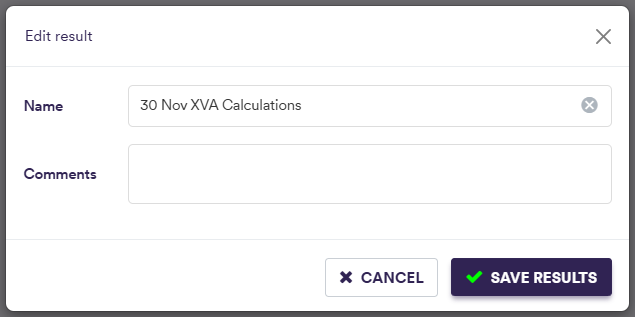
You can save the selected XVA calculation results by clicking on

At the XVA calculation results level (by double-clicking on the line item), the various valuation outputs are:
- trade PV, T0 cashflows and greeks on a trade basis (see Valuations)
- portfolio metrics (cashflows and bucketed greeks) (see Valuations)
- option expiry heatmaps (swaptions and FX options) (see Valuations)
- graphs of calibrated curves used in the valuation process (see Valuations)
- message log of events that were recorded during the valuation process (see Valuations)
In addition, the XVA calculations outputs are:
- XVA calculations and corresponding exposure profiles (if applicable) on a counterparty basis
- underlying exposure simulation results

After saving, XVA valuation results will also be accessible on a trade level in the trade valuation history screen (see Trade Valuation History).
1. XVA Calculation Results on a Counterparty Basis
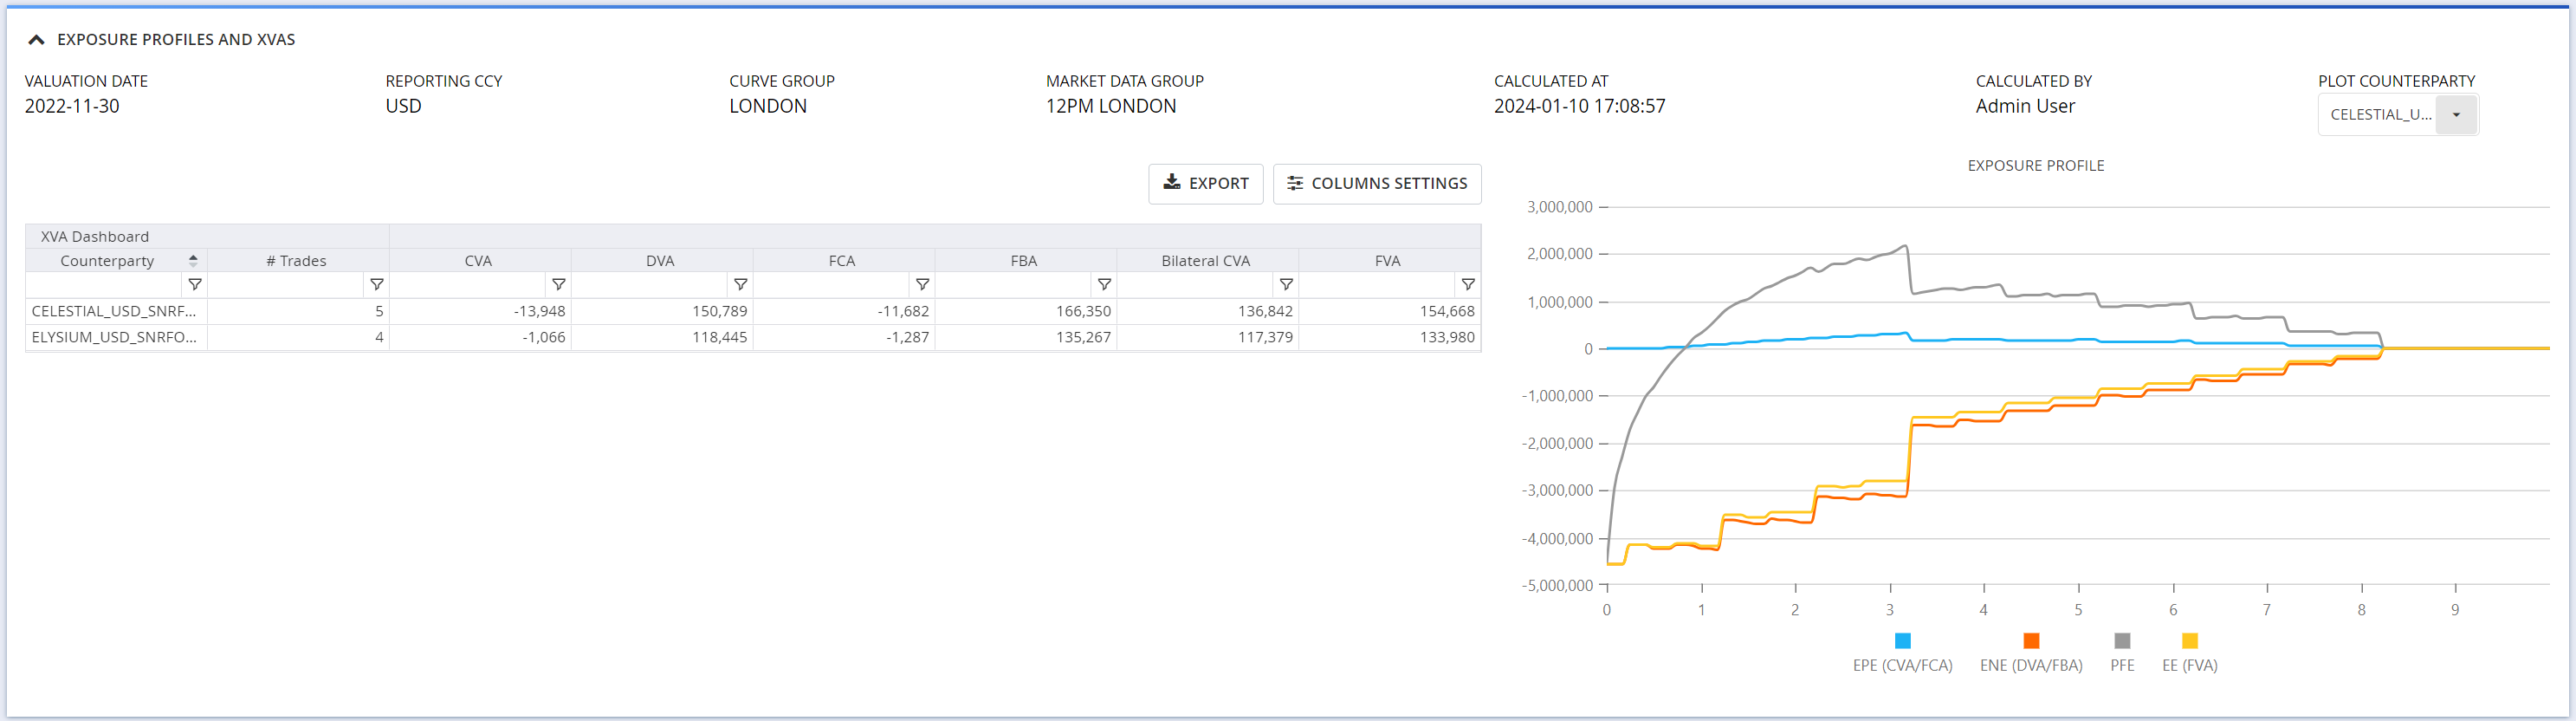
In the ‘Exposure Profiles And XVAs’ window, you can view, filter and export XVA calculation results on a counterparty basis.
If the XVA calculations have been performed to include exposure simulations, EPE, ENE, PFE and EE per counterparty will be plotted on the right hand side.
A description of the XVA calculation result outputs is set out in the table below.
| Field Name | Description |
|---|---|
| Counterparty | The counterparty credit curve reference |
| # Trades | The number of trades with the Counterparty |
| CVA | Credit value adjustment expressed in the Reporting Ccy |
| DVA | Debit value adjustment expressed in the Reporting Ccy |
| FCA | Funding cost adjustment expressed in the Reporting Ccy |
| FBA | Funding benefit adjustment expressed in the Reporting Ccy |
| Bilateral CVA | CVA + DVA |
| FVA | Funding valuation adjustment expressed in the Reporting Ccy |
2. Exposure Simulation Results
In the ‘Exposures’ window, when applicable, you can see and export exposure simulation results on a counterparty basis.
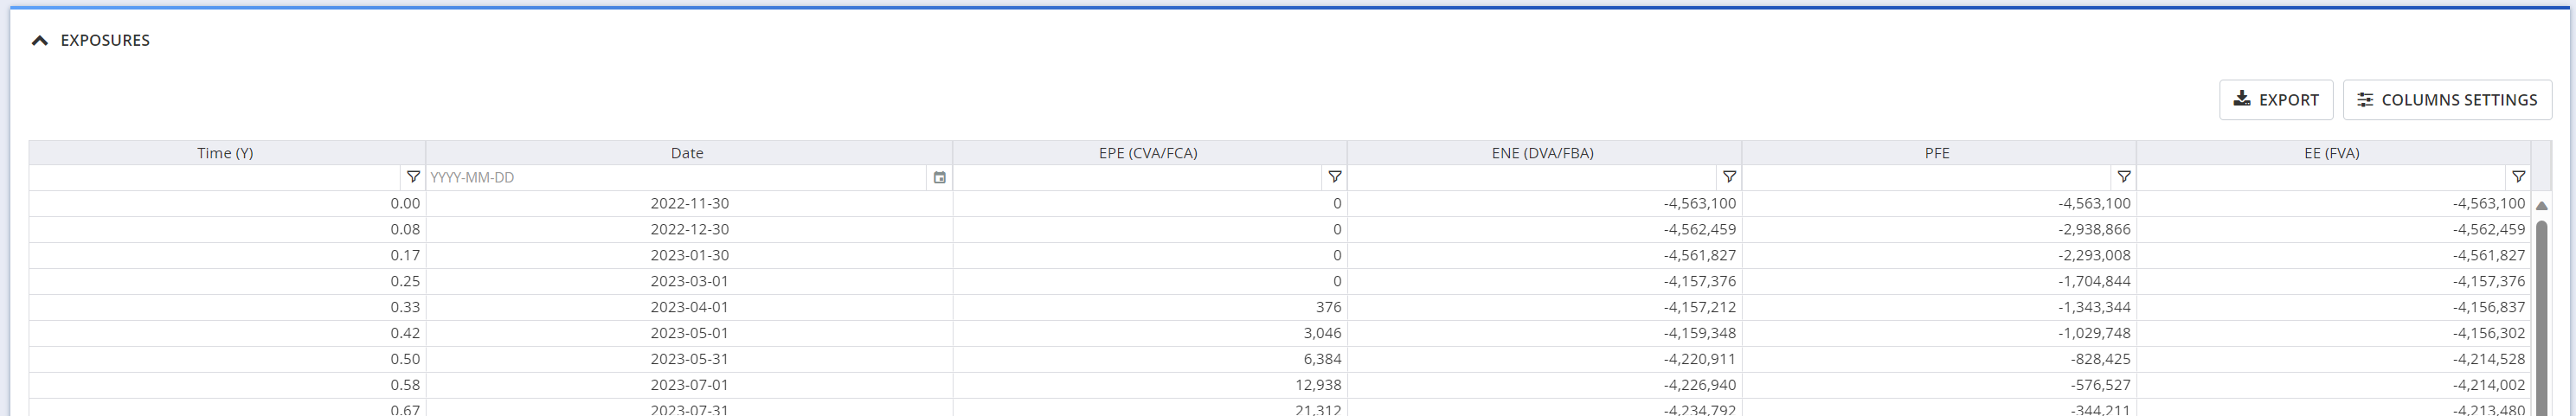
A description of the simulation result outputs is set out in the table below.
| Field Name | Description |
|---|---|
| Time (Y) | The date as of which the exposure is calculated (expressed in year from the valuation date) |
| Date | The date as of which the exposure is calculated |
| EPE (CVA/FCA) | The expected positive exposure for the selected counterparty, used to calculate CVA and FCA |
| ENE (DVA/FBA) | The expected negative exposure for the selected counterparty, used to calculate DVA and FBA |
| PFE | The potential future exposure for the selected counterparty |
| EE (FVA) | The expected exposure for the selected counterparty, used to calculate FVA |