Under
- Run the TRS accrual calculation process
- View the accrual calculation results and leg schedules on a trade basis
Running TRS Accrual Calculations
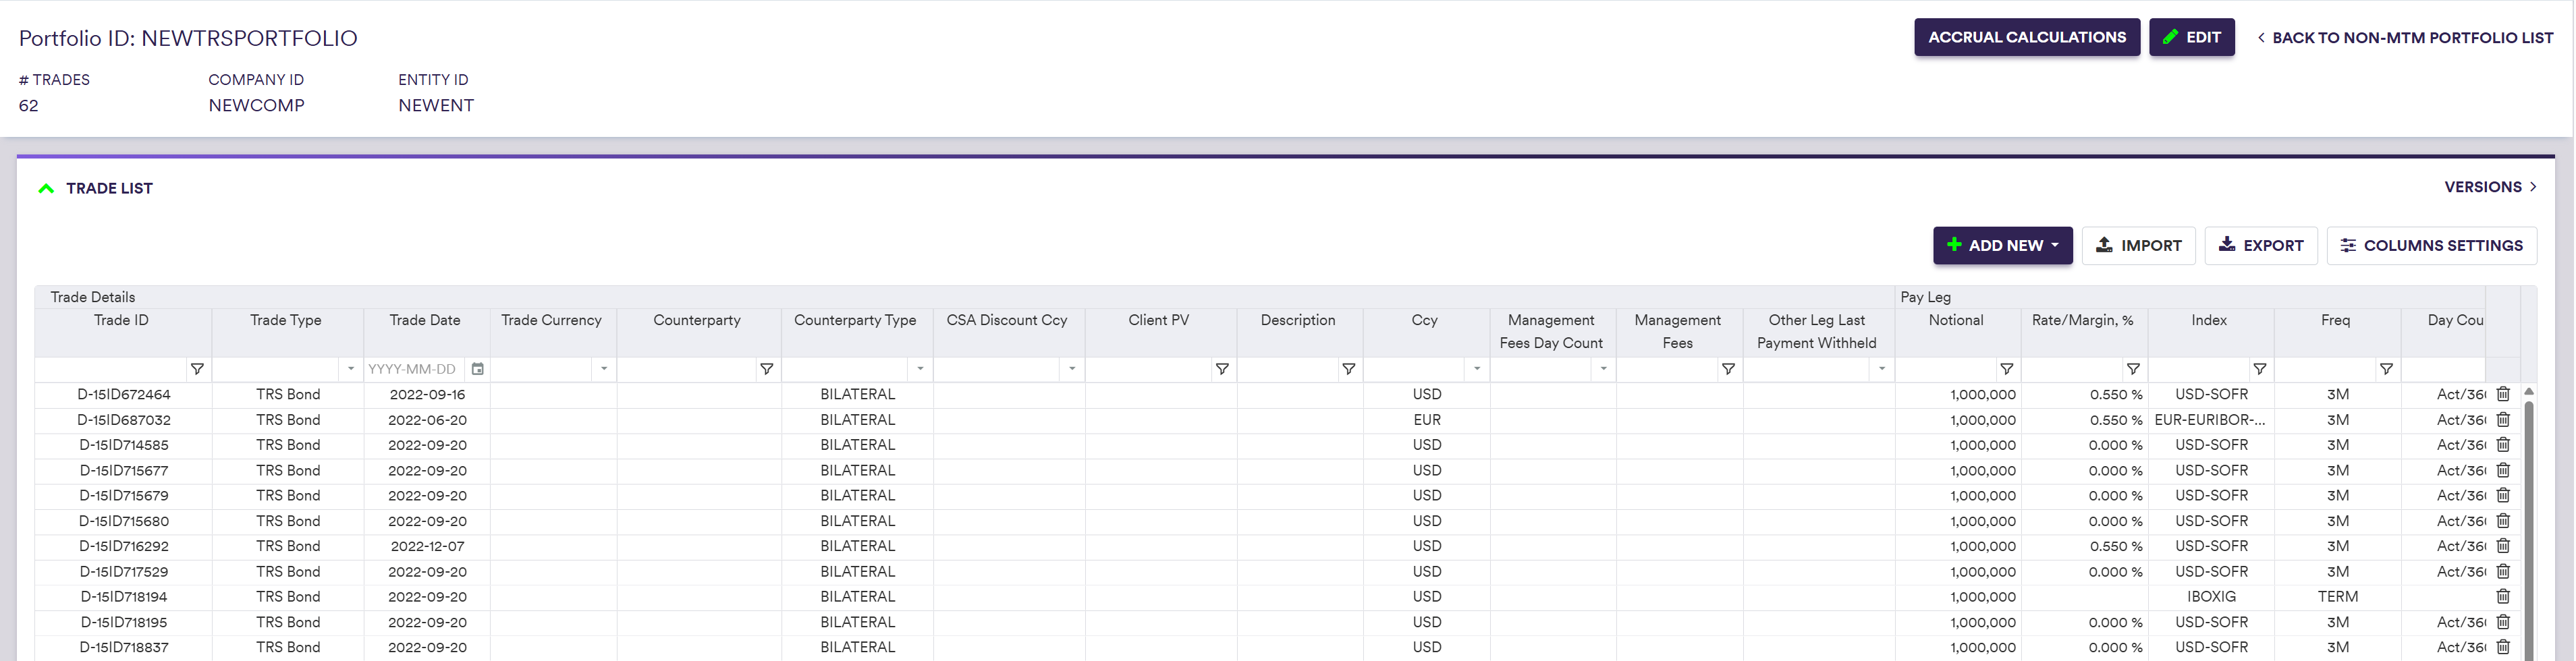
Once you have defined a curve configuration, a market data environment, a TRS market data environment, a non-MTM portfolio and the relevant valuation settings, the TRS accrual calculation interface can be accessed i) via the portfolio under
Under
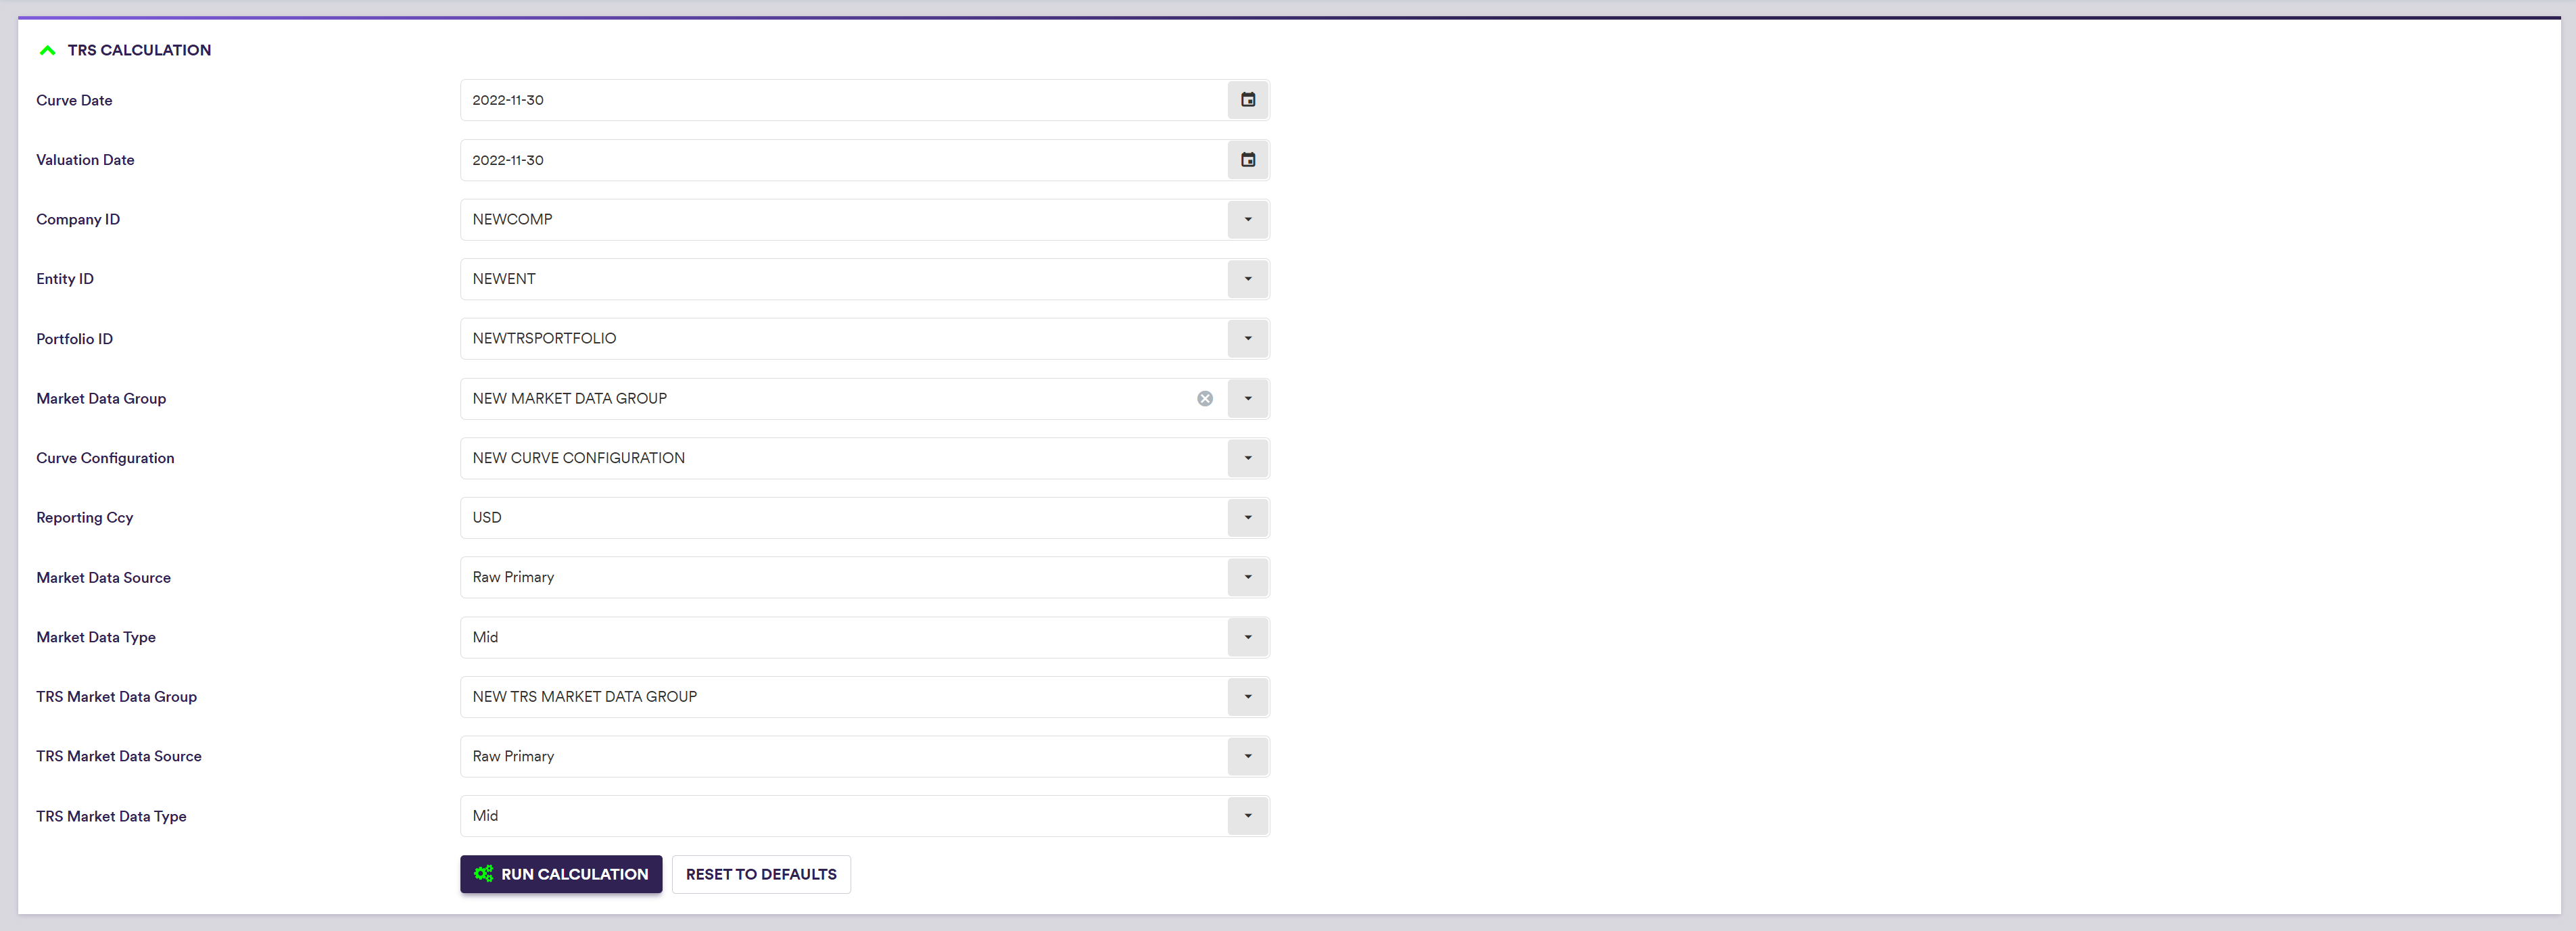
A description of the valuation settings and corresponding permissible values are set out in the table below.
| Field Name | Description | Permissible Values | TYPE |
|---|---|---|---|
| Curve Date | The market data’s historical curve date (default = system date) | YYYY-MM-DD (ISO 8601) | M |
| Valuation Date | The valuation date (default = Curve Date) | YYYY-MM-DD (ISO 8601) | M |
| Company ID | Company -> Entity -> Portfolio | Any existing Company ID | M |
| Entity ID | Company -> Entity -> Portfolio | Any existing Entity ID | M |
| Portfolio ID | Company -> Entity -> Portfolio | Any existing Portfolio ID | M |
| Market Data Group | The market data group that contains the raw market data (optional) | See market data | O |
| Curve Configuration | The applicable curve configuration(s) when a Market Data Group has been specified | See curve configuration | C |
| Reporting Ccy | The currency in which the calculation results are expressed when a Market Data Group has been specified | Any permissible currency | C |
| Market Data Source |
Data type (raw, preliminary cleansed or overlay) + Data provider (primary or secondary), when a Market Data Group has been specified |
RAW PRIMARY | RAW SECONDARY PRELIMINARY PRIMARY | PRELIMINARY SECONDARY OVERLAY See using MD exception management results | C |
| TRS Market Data Group | The market data group that contains the raw market data | See TRS market data | M |
| TRS Market Data Source (*) | Data provider (primary or secondary) + Data type (raw, preliminary cleansed or overlay) |
RAW PRIMARY | RAW SECONDARY PRELIMINARY PRIMARY | PRELIMINARY SECONDARY OVERLAY See using MD exception management results | M |
| TRS Market Data Type | Market data side for projection | Bid | Mid | Ask | M |
Accrual Calculation Results
Once a portfolio has been valued (after clicking on
You can save the selected calculation results by clicking on
Calculation results can also be accessed under

At the calculation results level (by double-clicking on the line item), the various outputs are:
- Trades accrual calculations on a trade basis;
- Leg schedules and historical cashflows for a selected trade;
- Message log of events that were recorded during the calculation process.
After saving, valuation results will also be accessible on a trade level in the TRS trade valuation history screen (see Trade Valuation History).
1. Results on a Trade Basis
In the “TRS TRADES PV” window, you can view, filter and export calculation results on a trade basis.
By double-clicking on the line item, you can view the full trade details.
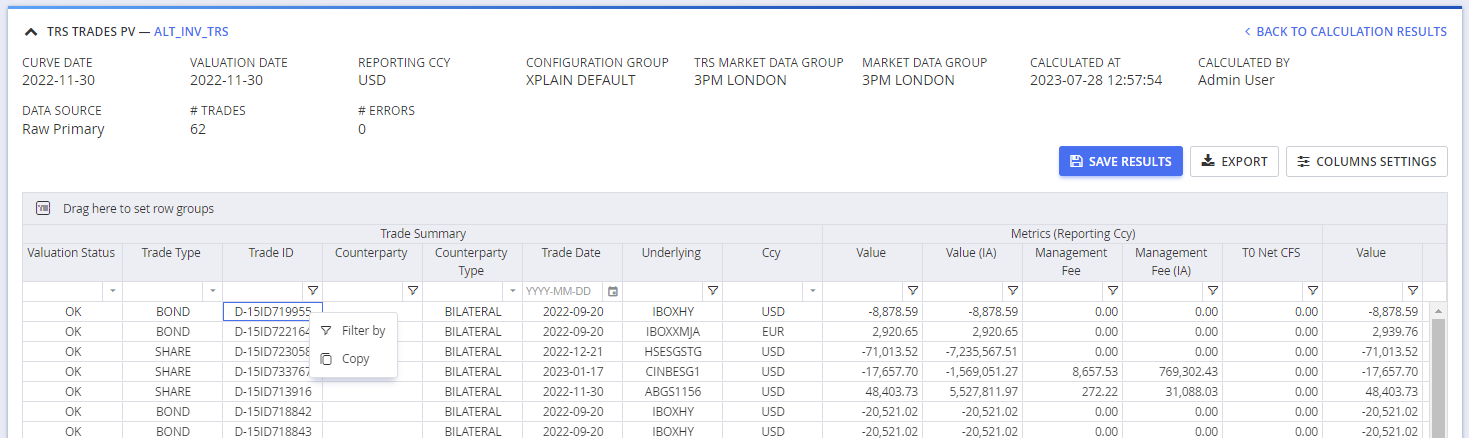
A description of the result outputs on a trade basis is set out in the table below.
| CATEGORY | Field Name | Description / PERMISSIBLE VALUE |
|---|---|---|
| Trade Summary | Trade Date | Trade Date |
| Trade Summary | Trade Type | TRS_BOND | TRS_SHARE |
| Trade Summary | Trade ID | Trade unique identifier |
| Trade Summary | Counterparty | Counterparty |
| Trade Summary | Counterparty Type | BILATERAL |
| Trade Summary | Underlying | The trade index(es) |
| Trade Summary | Ccy | The trade currency |
| Trade Summary | Valuation Status | OK | ERROR (hover to see error type) |
| Trade Summary | Error | no error | ERROR MESSAGE |
| Metrics (Reporting Ccy / Trade Ccy) | Value | Value |
| Metrics (Reporting Ccy / Trade Ccy) | Value (IA) | Index adjusted value |
| Metrics (Reporting Ccy / Trade Ccy) | Management Fee | Management fee |
| Metrics (Reporting Ccy / Trade Ccy) | Management Fee (IA) | Index adjusted management fee |
| Metrics (Reporting Ccy / Trade Ccy) | T0 Net CFS | T0 net cashflows |
| Pay Leg / Rec Leg (Reporting Ccy/ Trade Ccy) | Value | Leg value |
| Pay Leg / Rec Leg (Reporting Ccy/ Trade Ccy) | Value (IA) | Index adjusted trade leg value |
| Pay Leg / Rec Leg (Reporting Ccy/ Trade Ccy) | T0 CFS | Leg T0 cashflow |
| Pay Leg / Rec Leg | Notional | Leg notional |
| Pay Leg / Rec Leg | Index | Leg index |
| Pay Leg / Rec Leg | Rate/Margin, % | Leg fixed rate or margin, expressed in % |
| Pay Leg / Rec Leg | Freq | Leg frequency |
| Pay Leg / Rec Leg | Day Count | Leg daycount |
| Pay Leg / Rec Leg | Initial Coupon | The initial coupon |
| Pay Leg / Rec Leg | Base Index | Current base index |
| Pay Leg / Rec Leg | Base Index Date | Current base index date |
| Pay Leg / Rec Leg | Previous Base Index | Previous base index |
| Pay Leg / Rec Leg | Previous Base Index Date | Previous base index date |
| Pay Leg / Rec Leg | Current Period Dividends | Current period dividends |
| Pay Leg / Rec Leg | Reference Index | Current index value |
| Pay Leg / Rec Leg | Reference Index Date | Current index date |
| Pay Leg / Rec Leg | Start Date | Start Date |
| Pay Leg / Rec Leg | End Date | End Date |
2. TRS Leg Schedules and Historical Cashflows
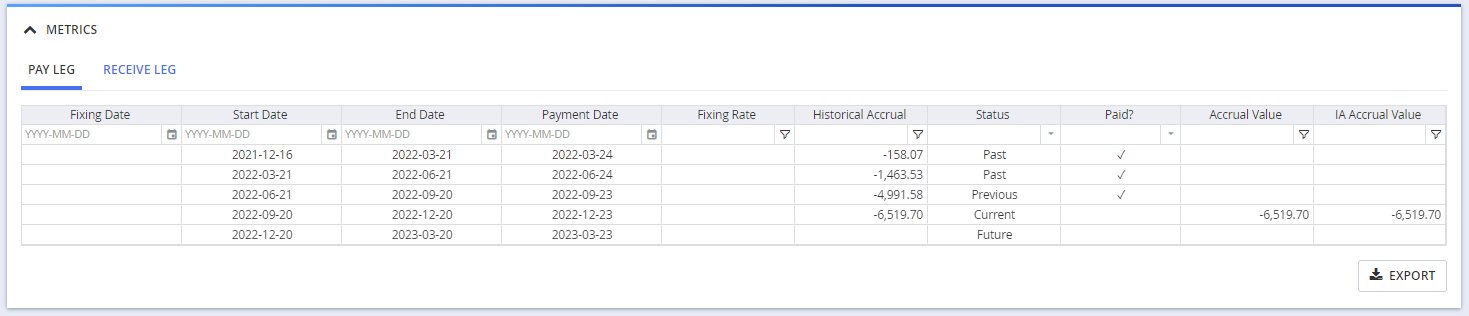
In the “METRICS” window, you can see and export leg schedules and historical accrual calculations on the selected trade. The schedule information will be split by leg.
A description of the result outputs on a portfolio basis is set out in the table below.
| Tab Name | Description | Additional Information |
|---|---|---|
| PAY LEG | Pay leg schedule including historial accrual calculations, expressed in the leg currency | For the selected trade |
| RECEIVE LEG | Receive leg schedule including historial accrual calculations, expressed in the leg currency | For the selected trade |
3. Message Log
Events (including warning or errors) logged during the valuation process will be set out in the “MESSAGE LOG” window.