At any point in a valuation data XM workflow, you can:
- view cleaned valuation data “as-you-go” on a VDK basis (*)
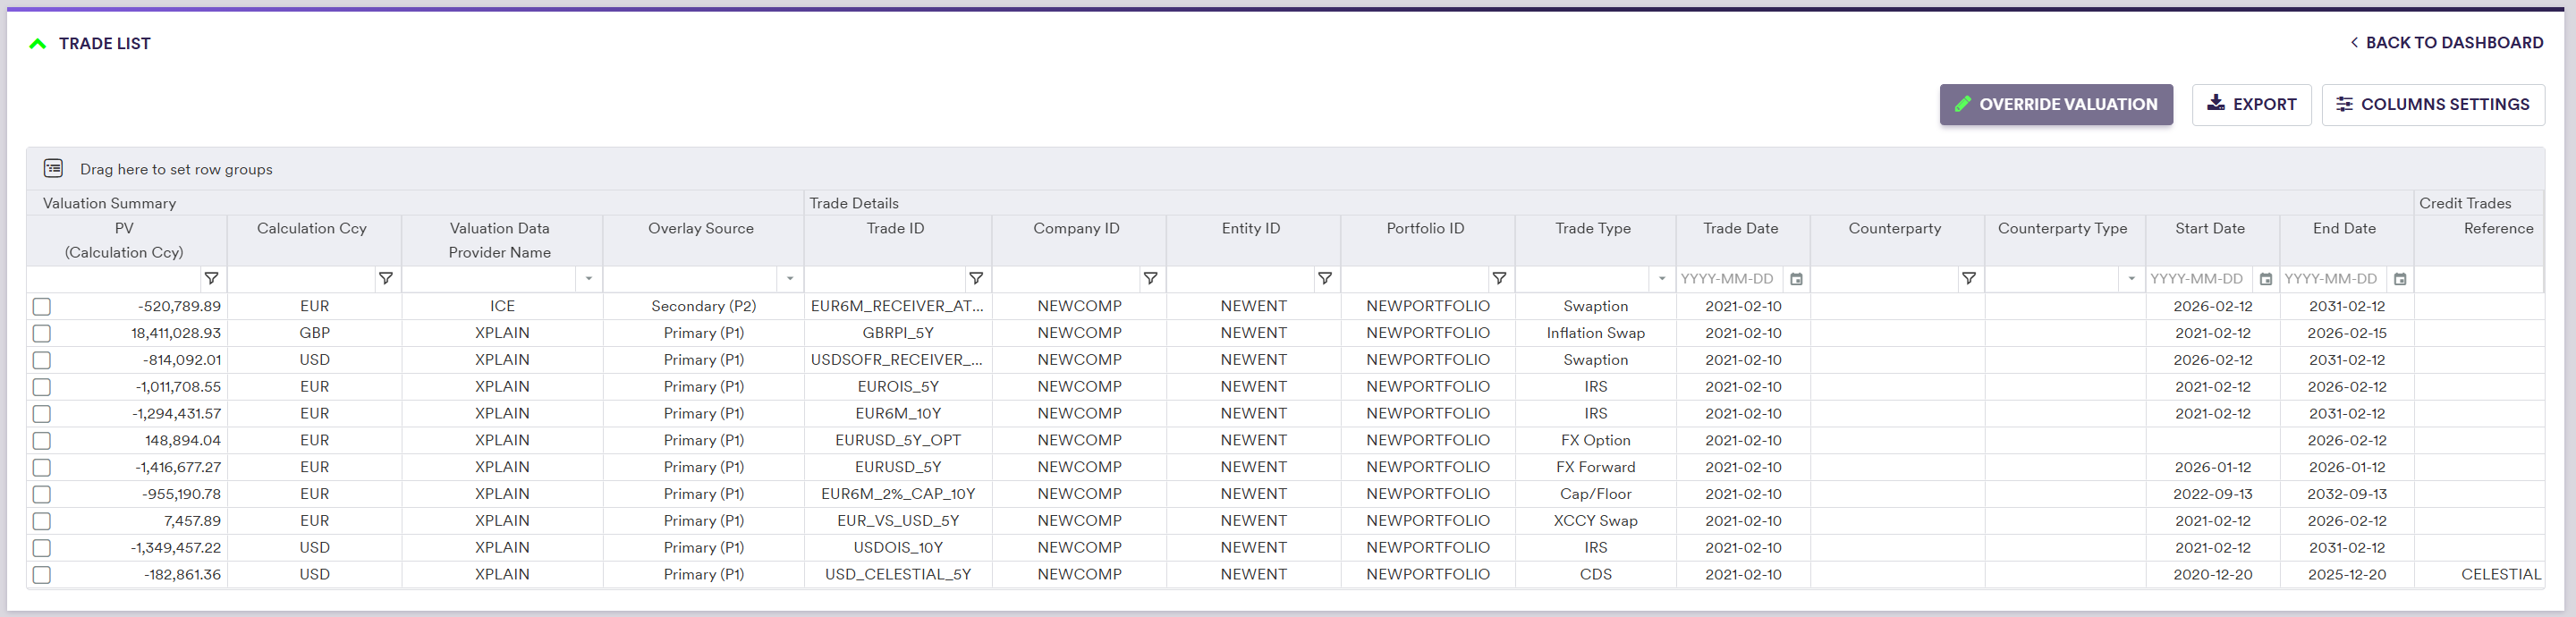
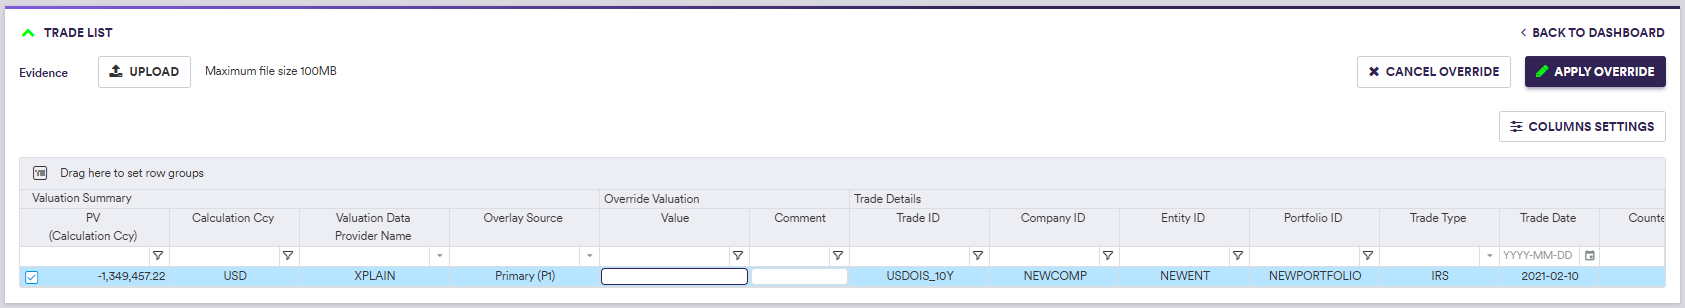
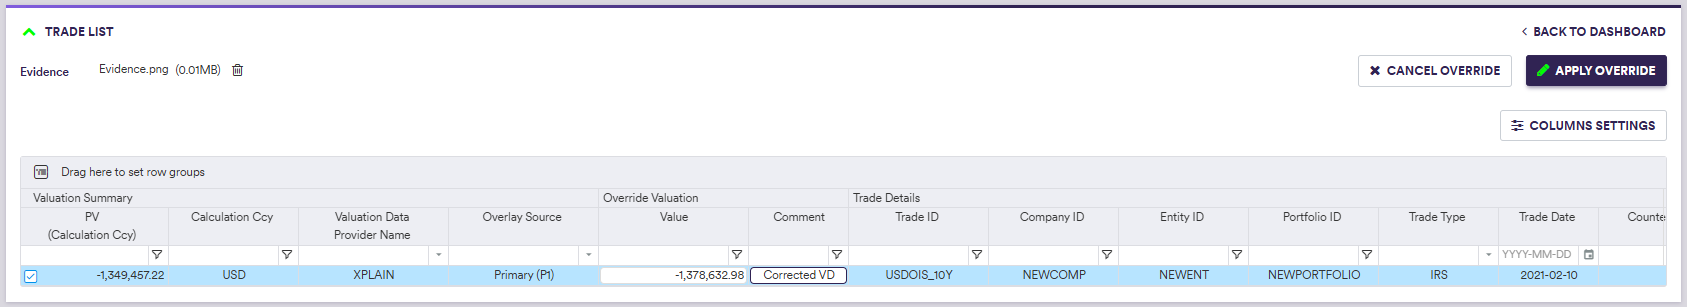
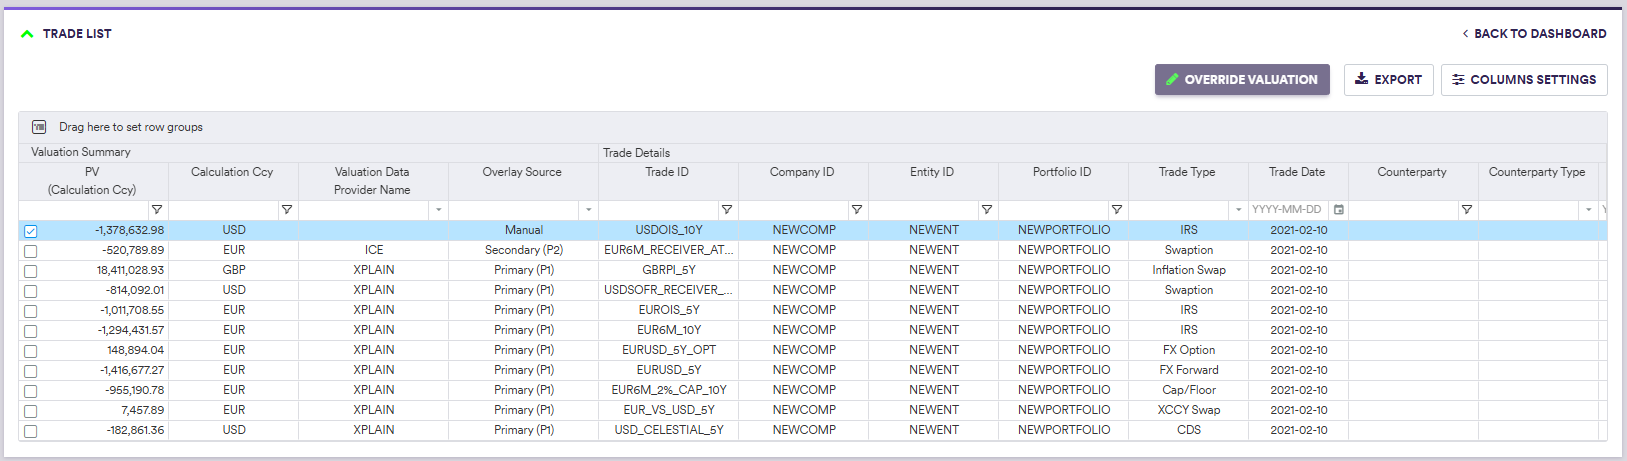
- manually override those cleaned valuation data, subject to evidence being uploaded (as it will impact the final reported numbers)
- access Xplain’s PV Calculation results, if Xplain is one of the valuation data providers (**)
From the dashboard, you will be able to select and re-run any sub-stream of a valuation data break clearing phase.
After saving a valuation data dashboard, XM VD results will be accessible on a trade level in the trade valuation history window.
1. Viewing Valuation Data XM Results
Under
- on a portfolio basis (by selecting the relevant portfolio in the ‘PORTFOLIO STATS’ tab)
- on a combined basis across all portfolios (by selecting the ‘ALL XM RESULTS’ tab)
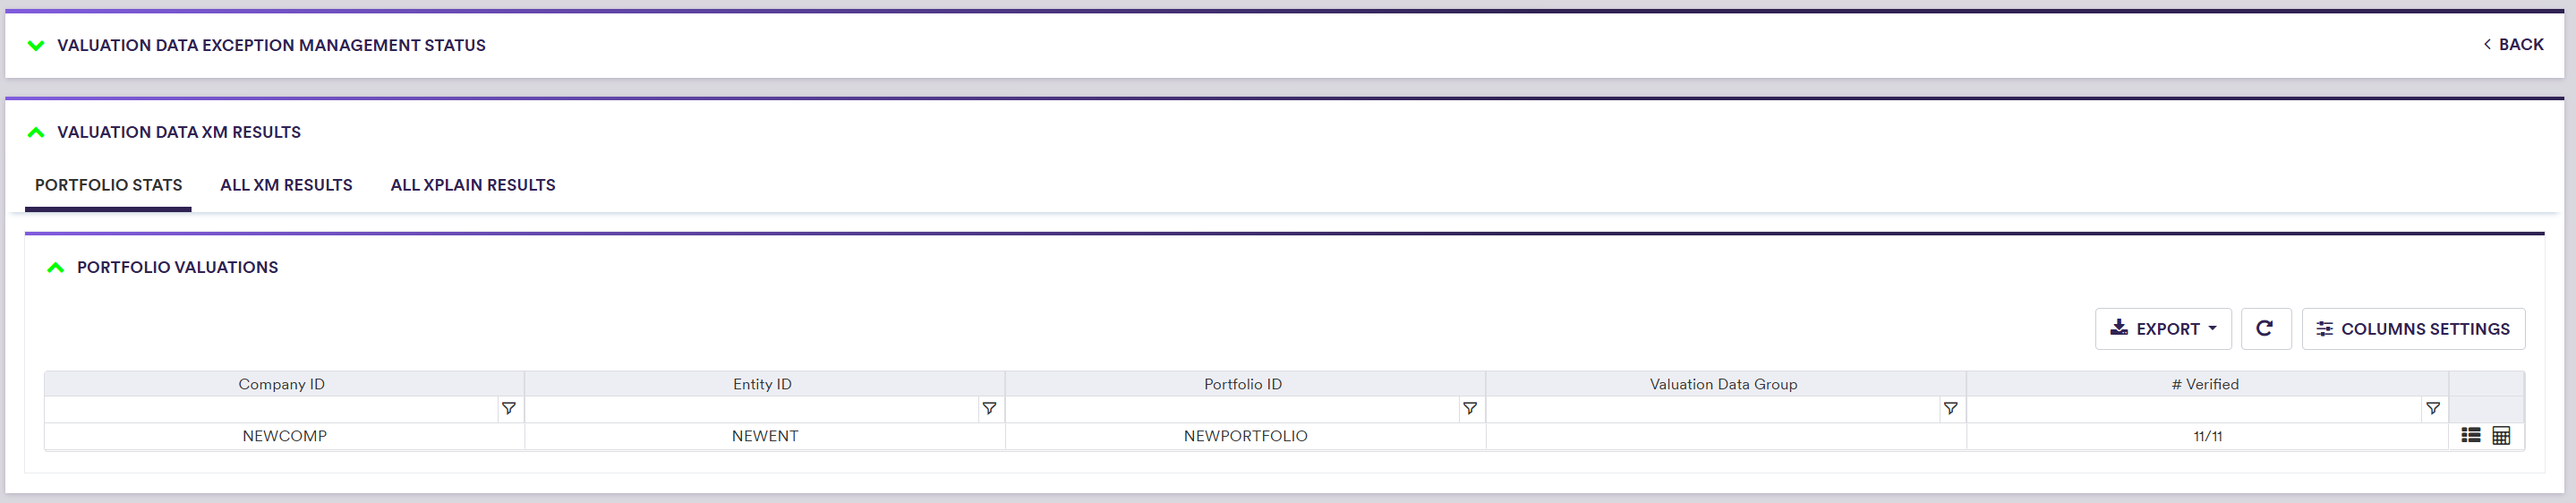
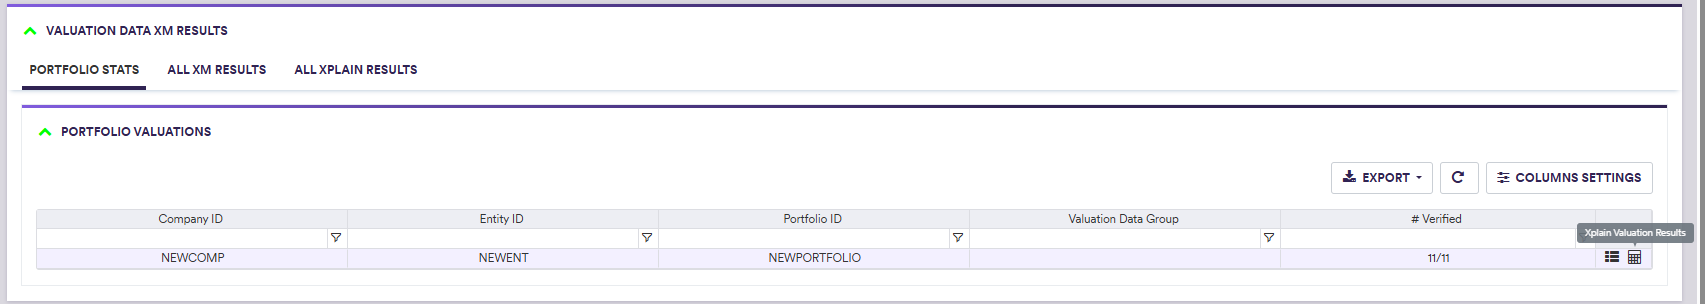
Valuation Data XM Results on a Portfolio Basis
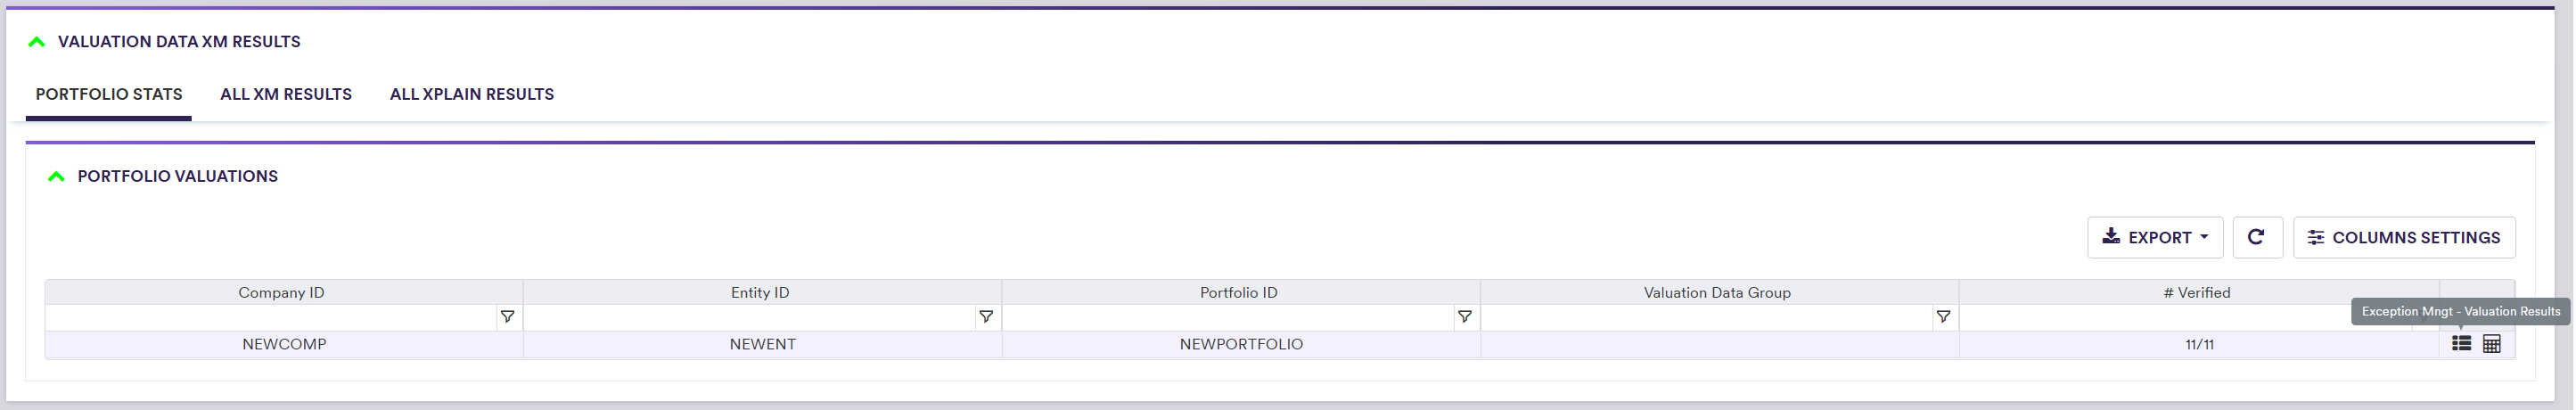
In the ‘PORTFOLIO STATS’ window, you can view and export valuation data XM results or access Xplain’s PV calculations for a given portfolio, by clicking first on the relevant icon (on the right hand side of the window).
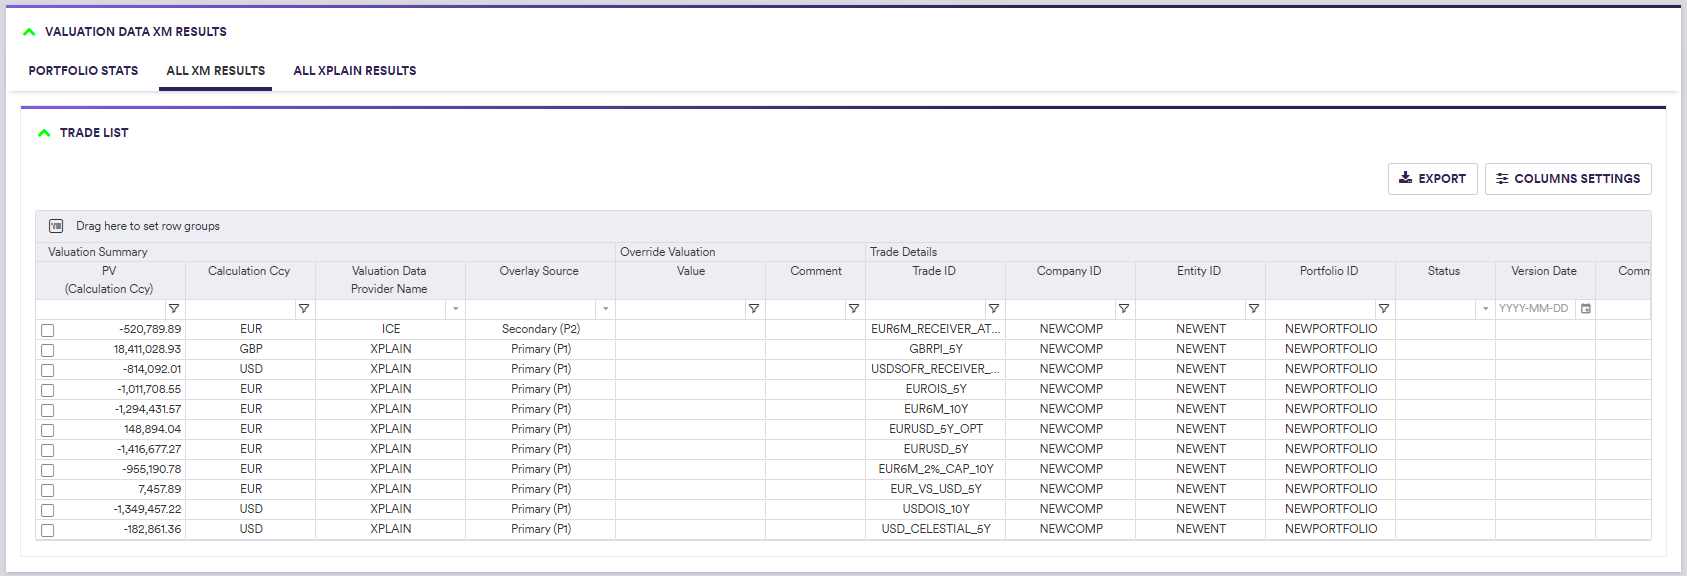
The valuation data XM results will include a subset of each trade’s details, as well as the final valuation summary, as set out in the table below.
Valuation Data XM Results on a Combined Basis Across All Portfolios
In the ‘ALL XM RESULTS’ tab, you can view and export valuation data XM results for all portfolios combined, including a subset of each trade’s details, as well as the final valuation summary. In our example, we only have one portfolio so the output will be the same as the one that you can access from the ‘PORTFOLIO STATS’ window, as described above.
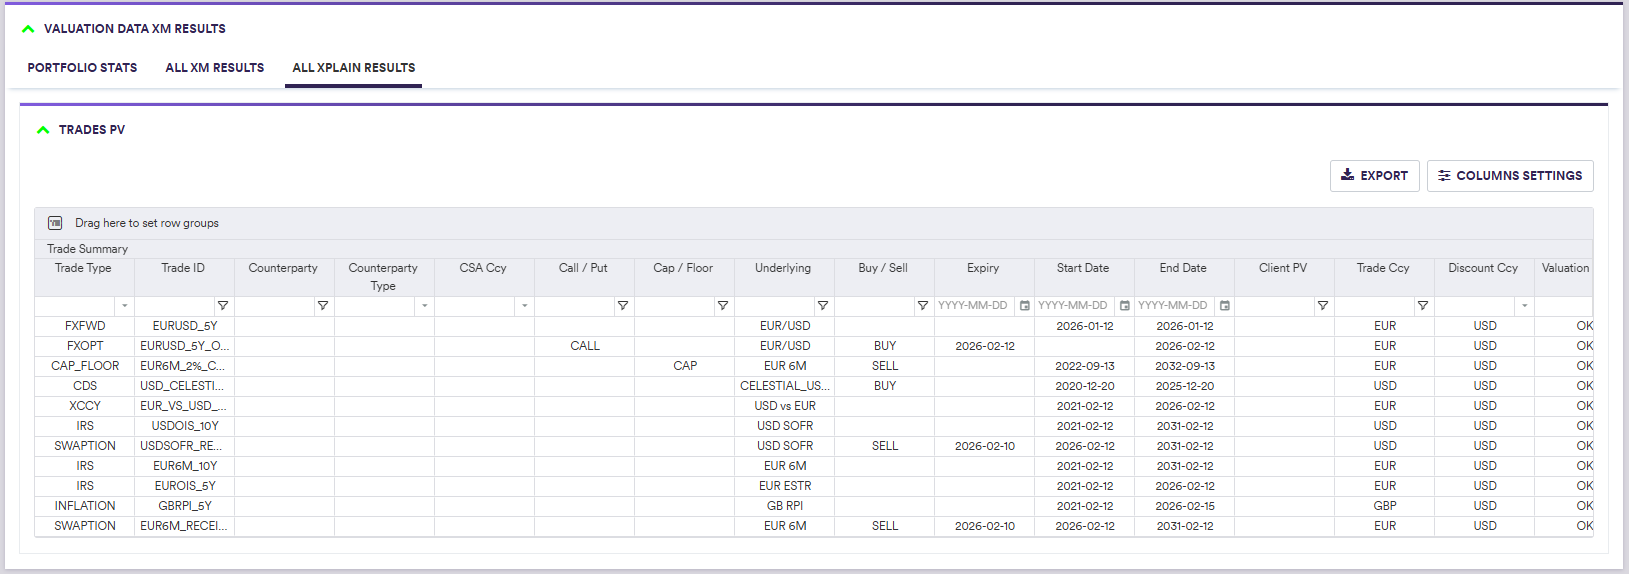
Where Xplain is one of the valuation data providers, in the ‘ALL XPLAIN RESULTS’ tab, you can access Xplain’s PV calculation results for all portfolios combined.
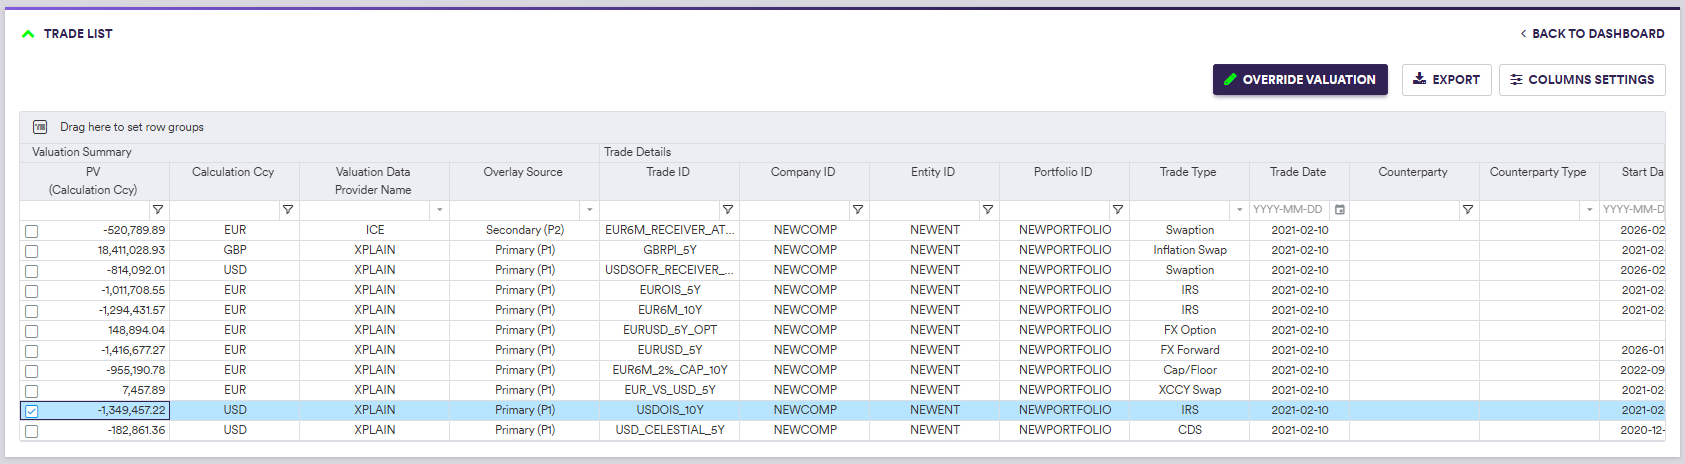
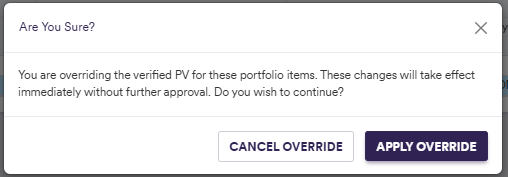
2. Overriding Valuation Data XM Results
Under
For the purpose of this example, a dummy evidence file can be downloaded here 
3. Accessing Xplain PV Calculation Results
Under
- on a portfolio basis (by selecting the relevant portfolio in the ‘PORTFOLIO STATS’ tab)
- on a combined basis across all portfolios (by selecting the ‘ALL XPLAIN RESULTS’ tab)
Xplain’s calculations will be available only if Xplain is one of the valuation data providers.
Xplain PV Calculation Results on a Portfolio Basis
In the ‘PORTFOLIO STATS’ window, you can view and export valuation data XM results or access Xplain’s PV calculations for a given portfolio, by clicking first on the relevant icon (on the right hand side of the window).
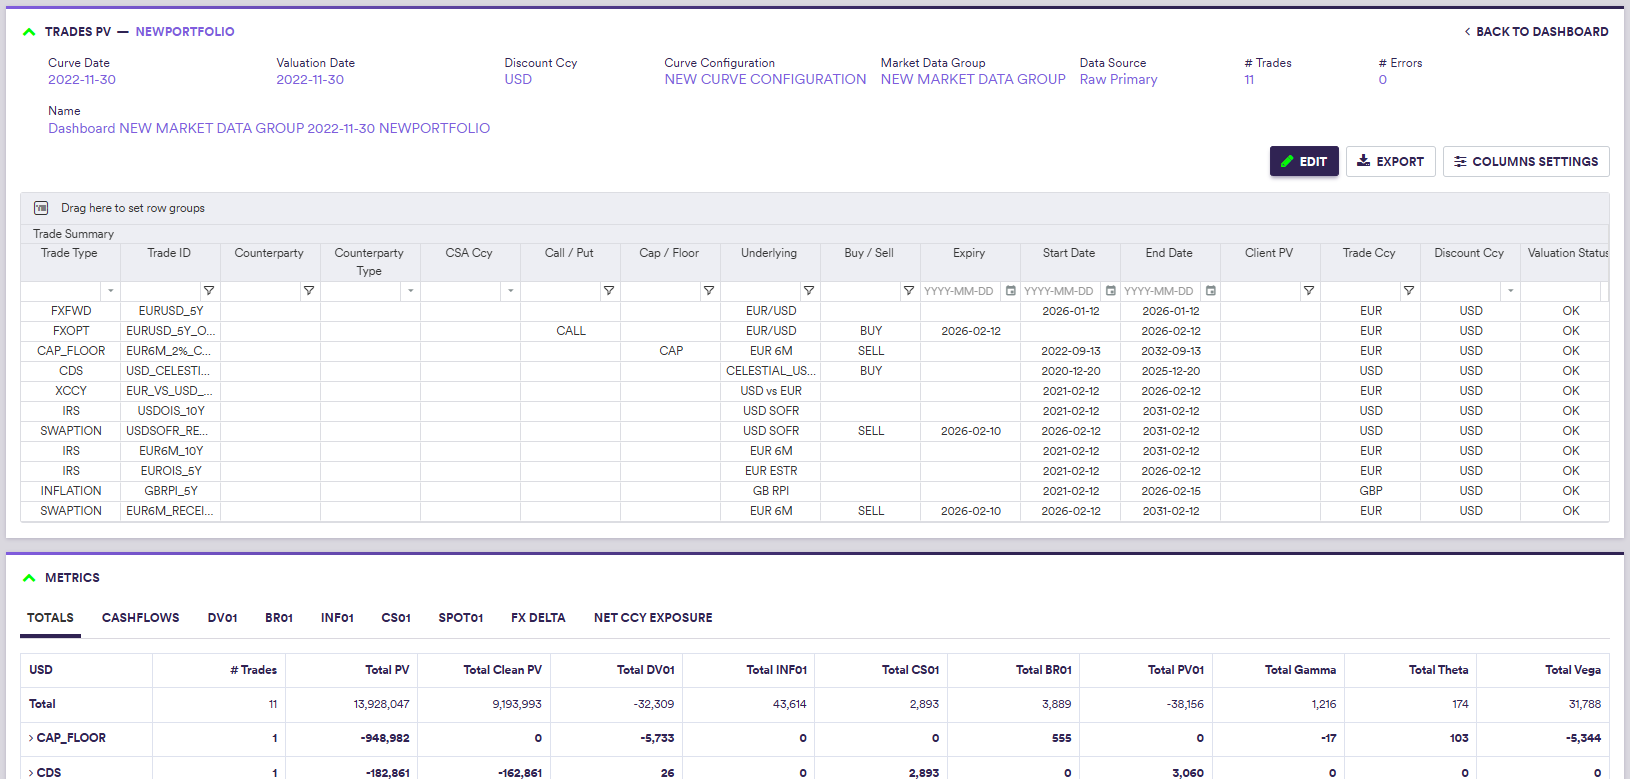
This are the same results as the ones you would get following a portfolio PV calculation in Xplain on a standalone basis, i.e. not part of a VD XM workflow.
Xplain PV Calculation Results on a Combined Basis Across All Portfolios
In the ‘ALL XPLAIN RESULTS’ tab, where Xplain is one of the valuation data providers, you can access Xplain’s PV calculation results for all portfolios combined. In our example, we only have one portfolio so the output will be similar to the one that you can access from the ‘PORTFOLIO STATS’ window, as described above, but without the portfolio metrics.