To have a pricing environment ready to perform valuations in Xplain, you will need to have a curve configuration.
But first, you will need to define a curve group (as described below) comprising the curves and volatility surfaces that are relevant for the pricing of your derivatives positions. A curve configuration will then link such curve group to preferred data providers (e.g. primary and secondary) on an instrument type basis
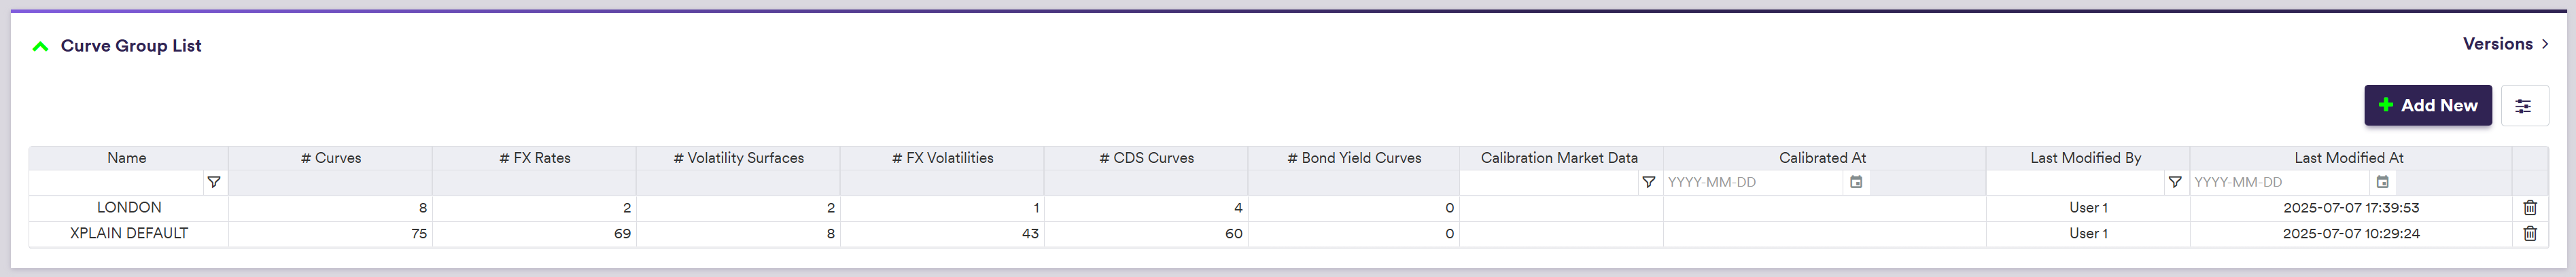
Curve Group Example
You can use the predefined ‘XPLAIN Default’ or ‘LONDON’ curve groups, or define your own independently. This page will guide you through the process using an example: defining a ‘NEW CURVE GROUP’ that replicates ‘LONDON’, which will be used with our ‘NEW CURVE CONFIGURATION’ example.
Curve Group Definition
The two steps required to define a curve curve are as follows:
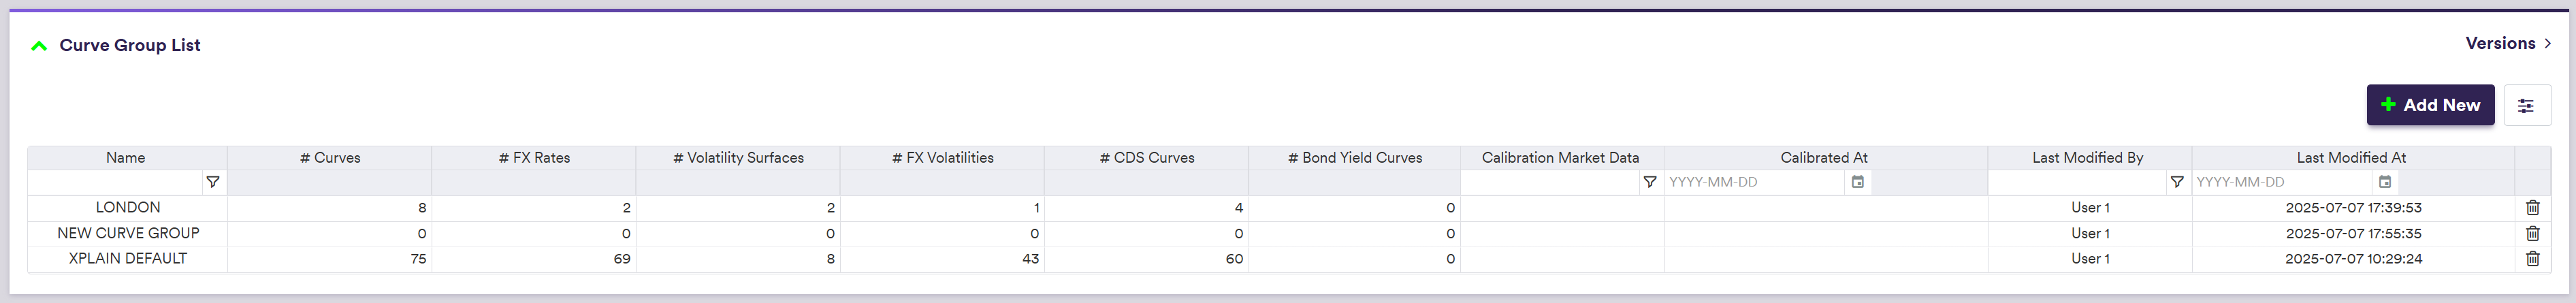
1. Creating a Curve Group
Under

2. Adding Curves and Volatility Surfaces
Once you have created the curve group, you can add a list of:
- IR + Inflation curves
- FX Rates
- IR Volatility surfaces
- FX Volatility surfaces
- Credit curves
- Bond Yield curves
For more details, please refer to the relevant page by clicking on the corresponding link.