With a hedge FX portfolio, you may want to assess the potential change in value and likelihood of exercise for FX options (call, put and collars) across various scenarios, and its impact on the net currency exposure.
You will first need to define the currency exposure cashflows that you will want to aggregate subsequently with your hedge FX trades. For more details, please refer to the Net Currency Exposure page.
On this page, we will discuss how to:
- simulate the valuation of a hedge FX portfolio across a range of Spot FX or FX volatilities
- view its impact on the net currency exposure
As pricing environment, you can use the predefined ‘XPLAIN Default’ curve configuration, ‘EUR_HY_PTF’ portfolio and ‘3PM LONDON’ market data group. As cashflows, you can use the predefined ‘USD_EXPOSURE’ and ‘POTENTIAL_USD_EXPOSURE’ currency exposure. You do not need to perform a portfolio PV calculation first, as this will be one of the scenarios.
Net Currency Exposure Simulation
Under
The net currency exposure will be calculated based on the selected eligible trades, as described here by the trade’s Custom Field.POTENTIAL_HEDGE attribute.
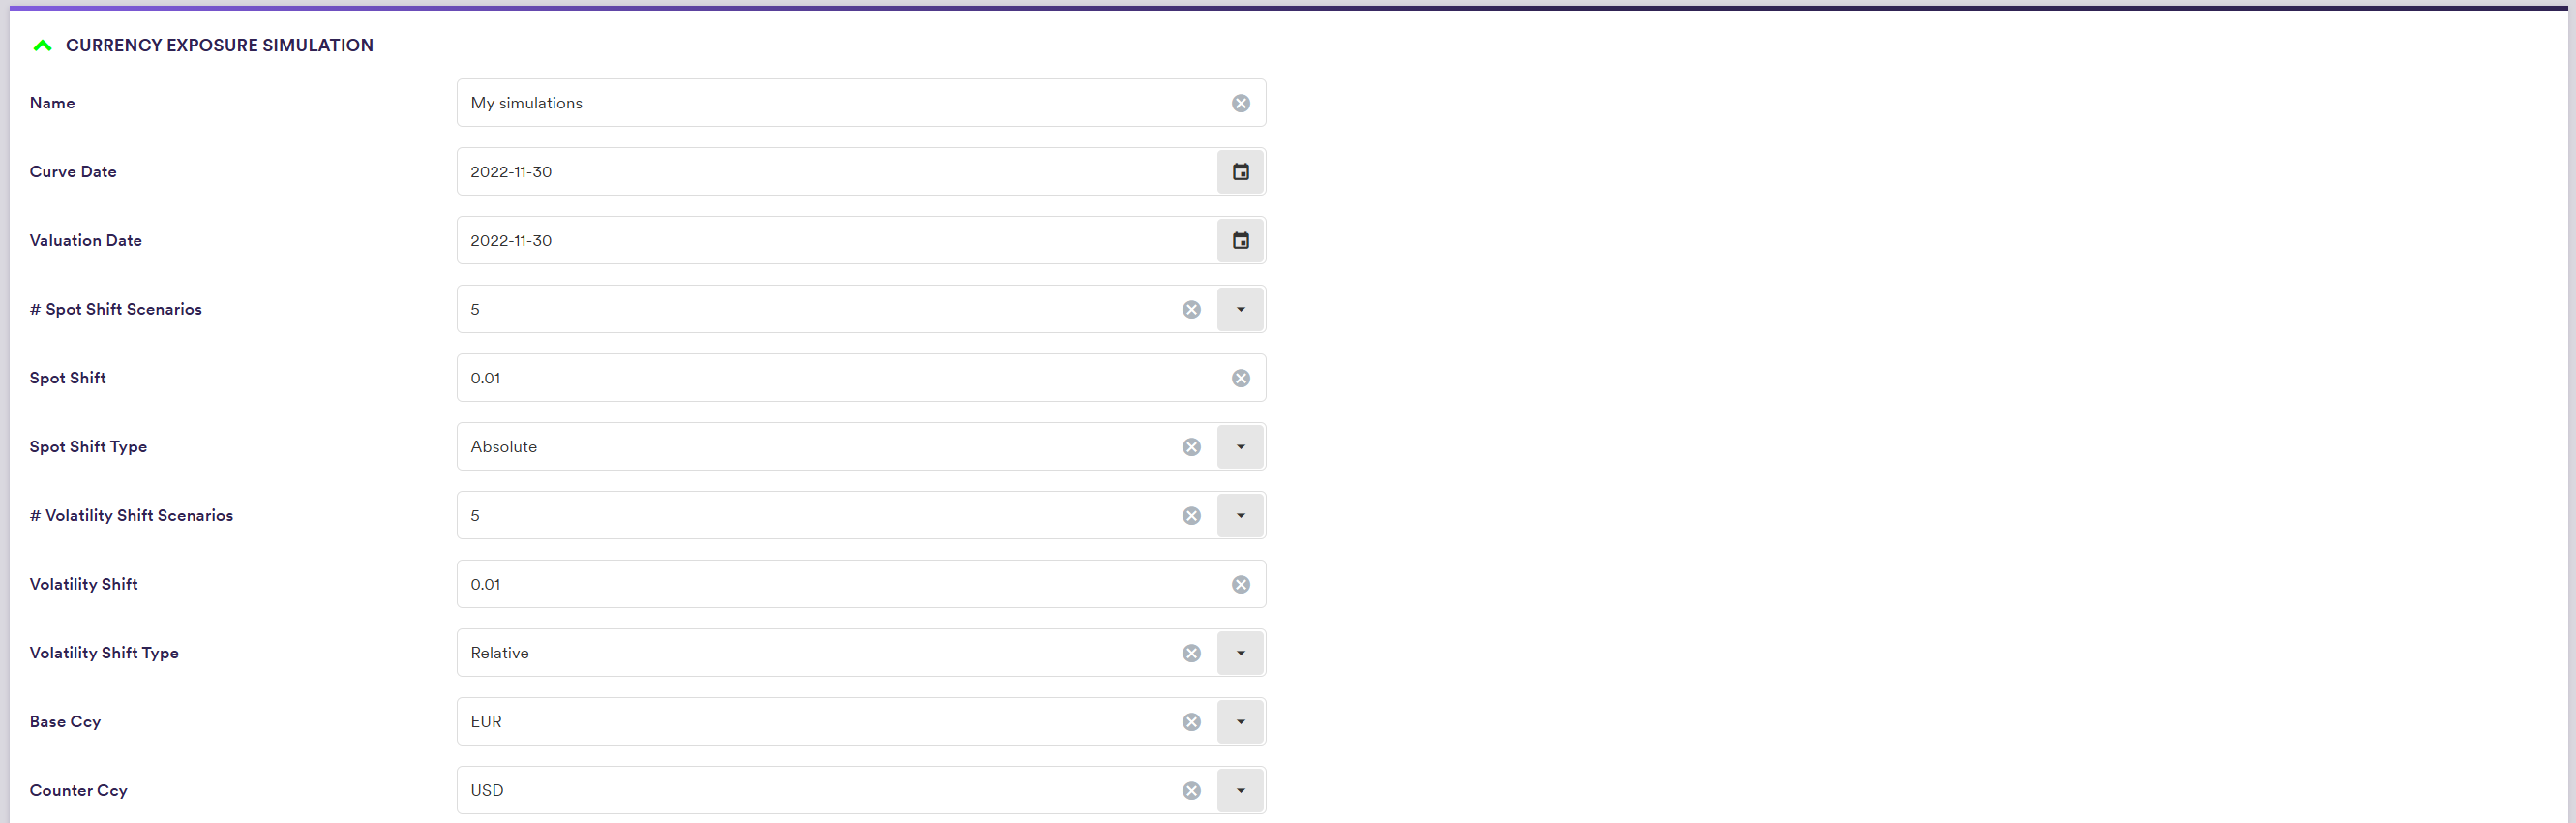
The additionals field in settings are set out in the table below.
| Field Name | Description | Permissible Values |
|---|---|---|
| # Spot Shift Scenarios | The number of Spot FX scenarios that will be applied in both directions | Integer (currently harcoded to 5) |
| Spot Shift | The Spot FX shift | Numeric |
| Spot Shift Type | The Spot FX shift type | ABSOLUTE | RELATIVE |
| # Volatility Shift Scenarios | The number of FX volatility scenarios that will be applied in both directions | Integer (currently harcoded to 5) |
| Volatility Shift | The FX volatility shift | Numeric |
| Volatility Shift Type | The FX volatility shift type | ABSOLUTE | RELATIVE |
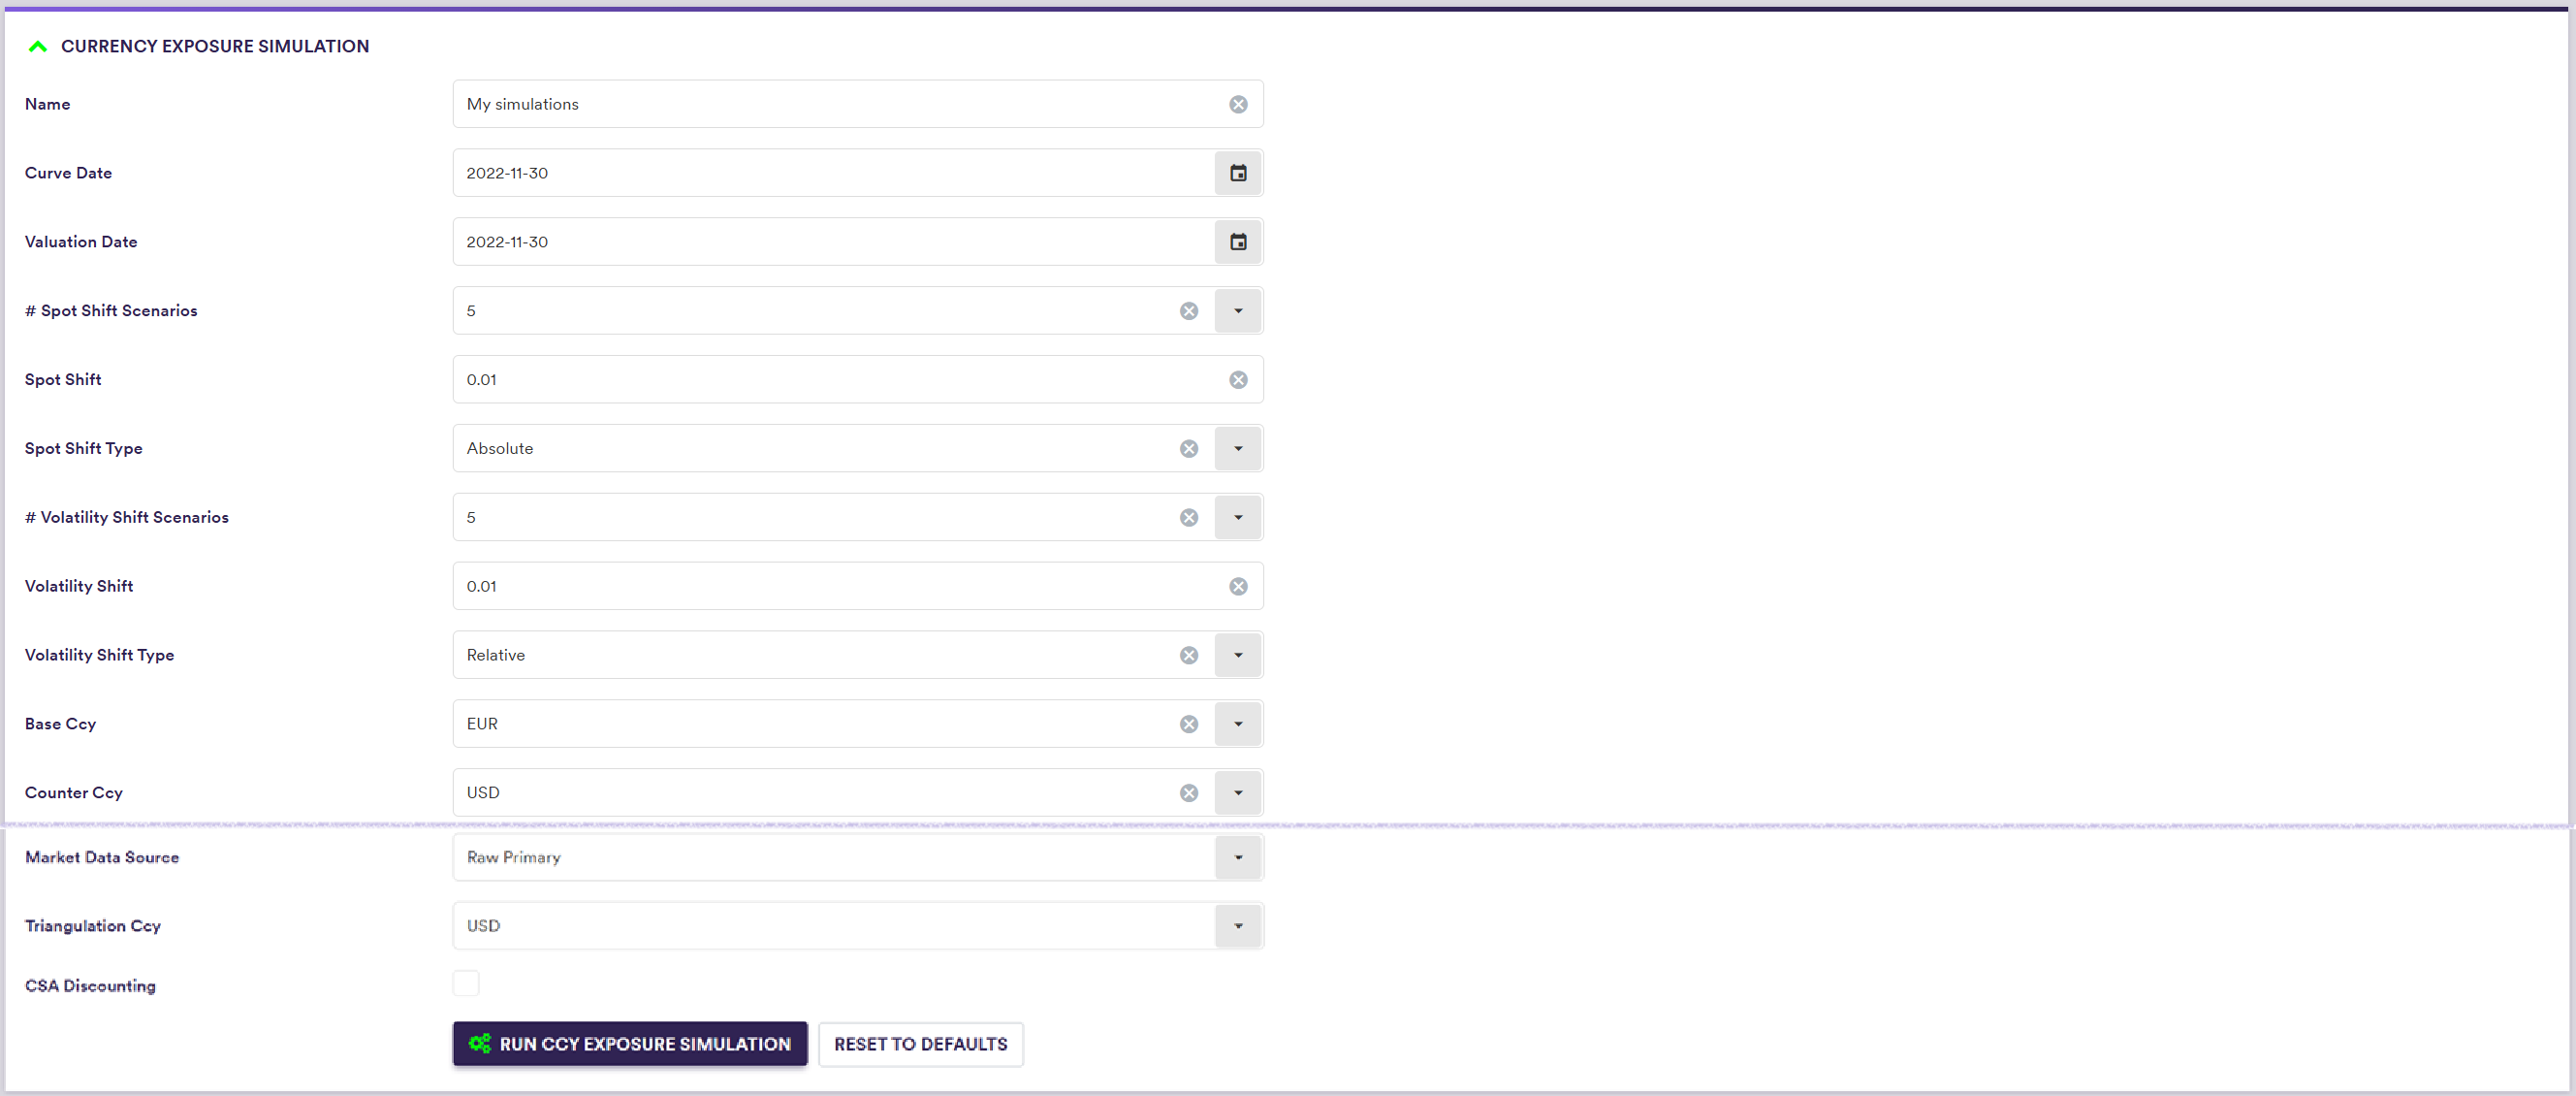
| Base Ccy | The FX rate's base currency. 3-letter ISO 4217 currency code. | Any currency in FX Cat A and FX Cat B |
| Counter Ccy | The FX rate's counter currency. 3-letter ISO 4217 currency code. | See FX Rate Rule |
BLUESTONE/HY_FUND/EUR_HY_PTF default valuation settings
The simulations on Spot FX and on FX volatilities will be run independently:
- the portfolio will first be re-valued with Spot FX shifted down and up
- it will then be re-valued with a parallel shift down and up of the corresponding FX volatilities (with no Spot FX shift applied)
Click on
Net Currency Exposure Simulation Results
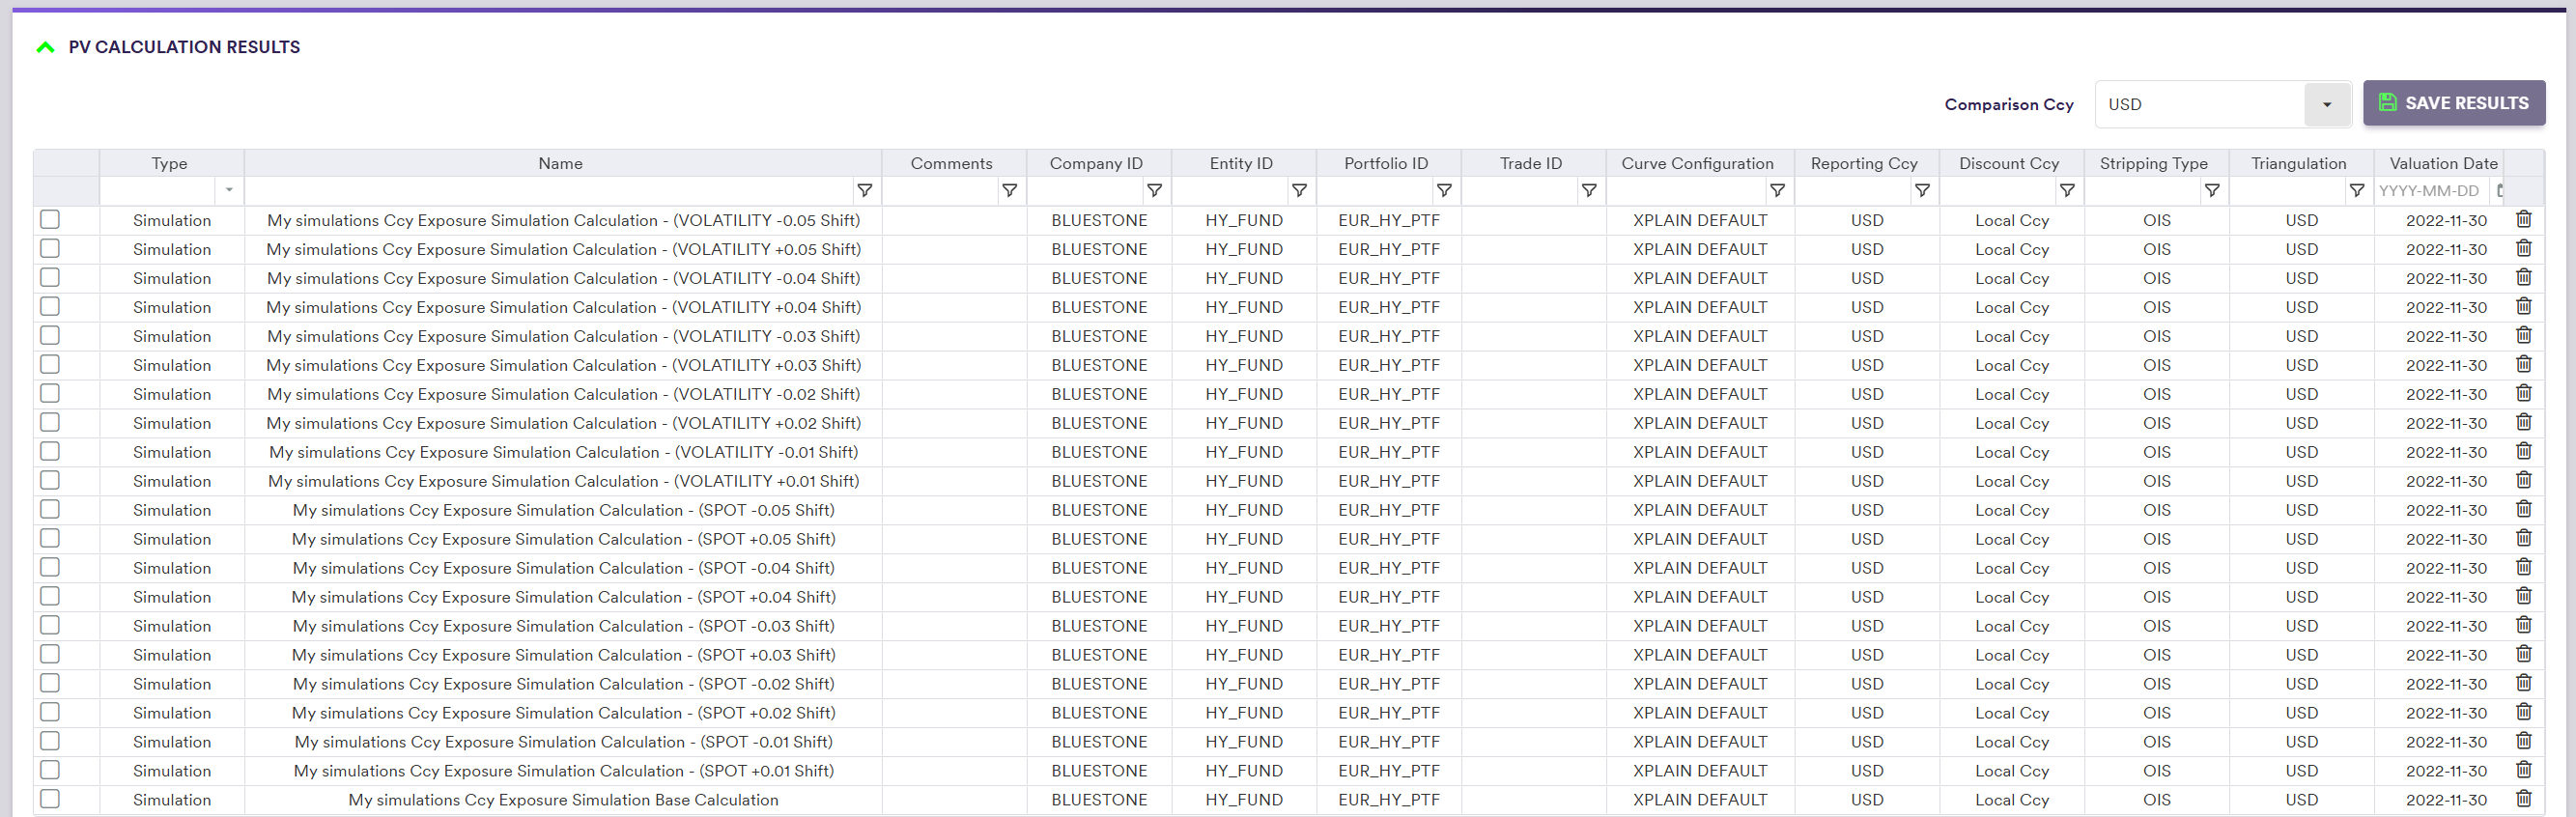
Once the calculations have been completed, the simulation line item will appear in the “CURRENCY EXPOSURE SIMULATION Results” window.

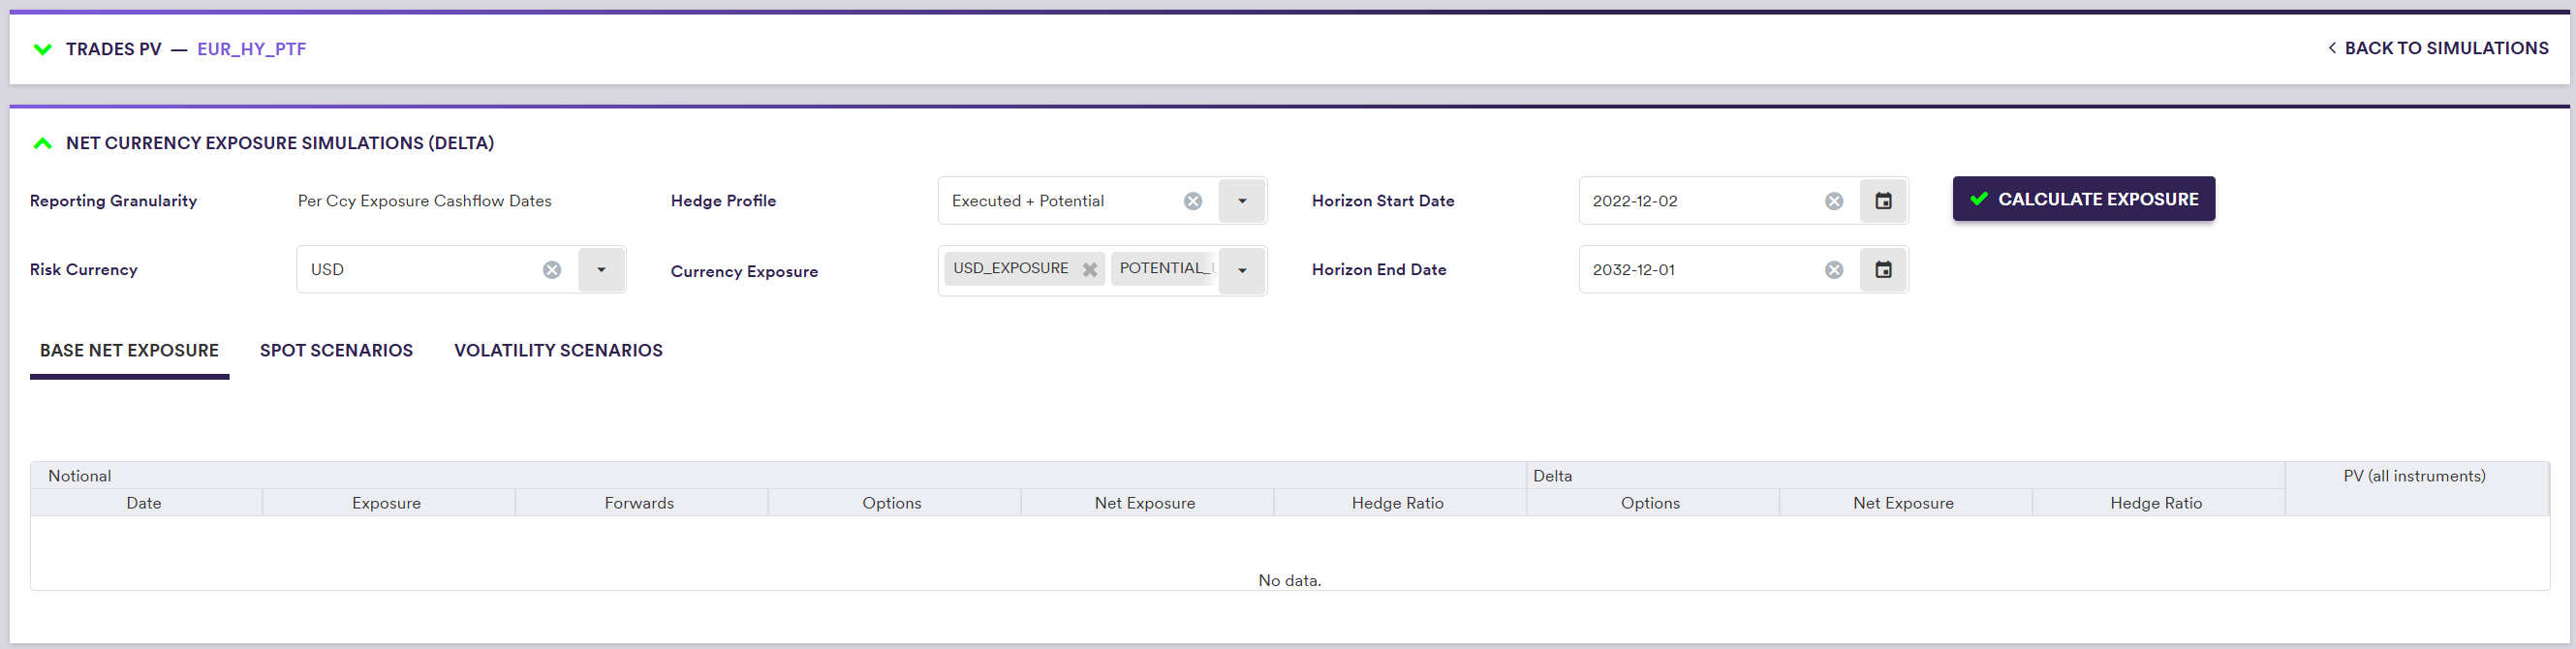
After double-clicking on the line item, in the “Net Ccy Exposure Simulations (Delta)” window, you can define the aggregation parameters (see here).
For example, you can use the predefined ‘USD*EXPOSURE’ and ‘POTENTIAL_USD_EXPOSURE’ currency exposure, and consider both existing and potential FX hedges as your Hedge Profile.
Click on
There are three sets of calculation results:
- base calculation results
- spot FX shift simulation results
- FX volatility shift simulation results
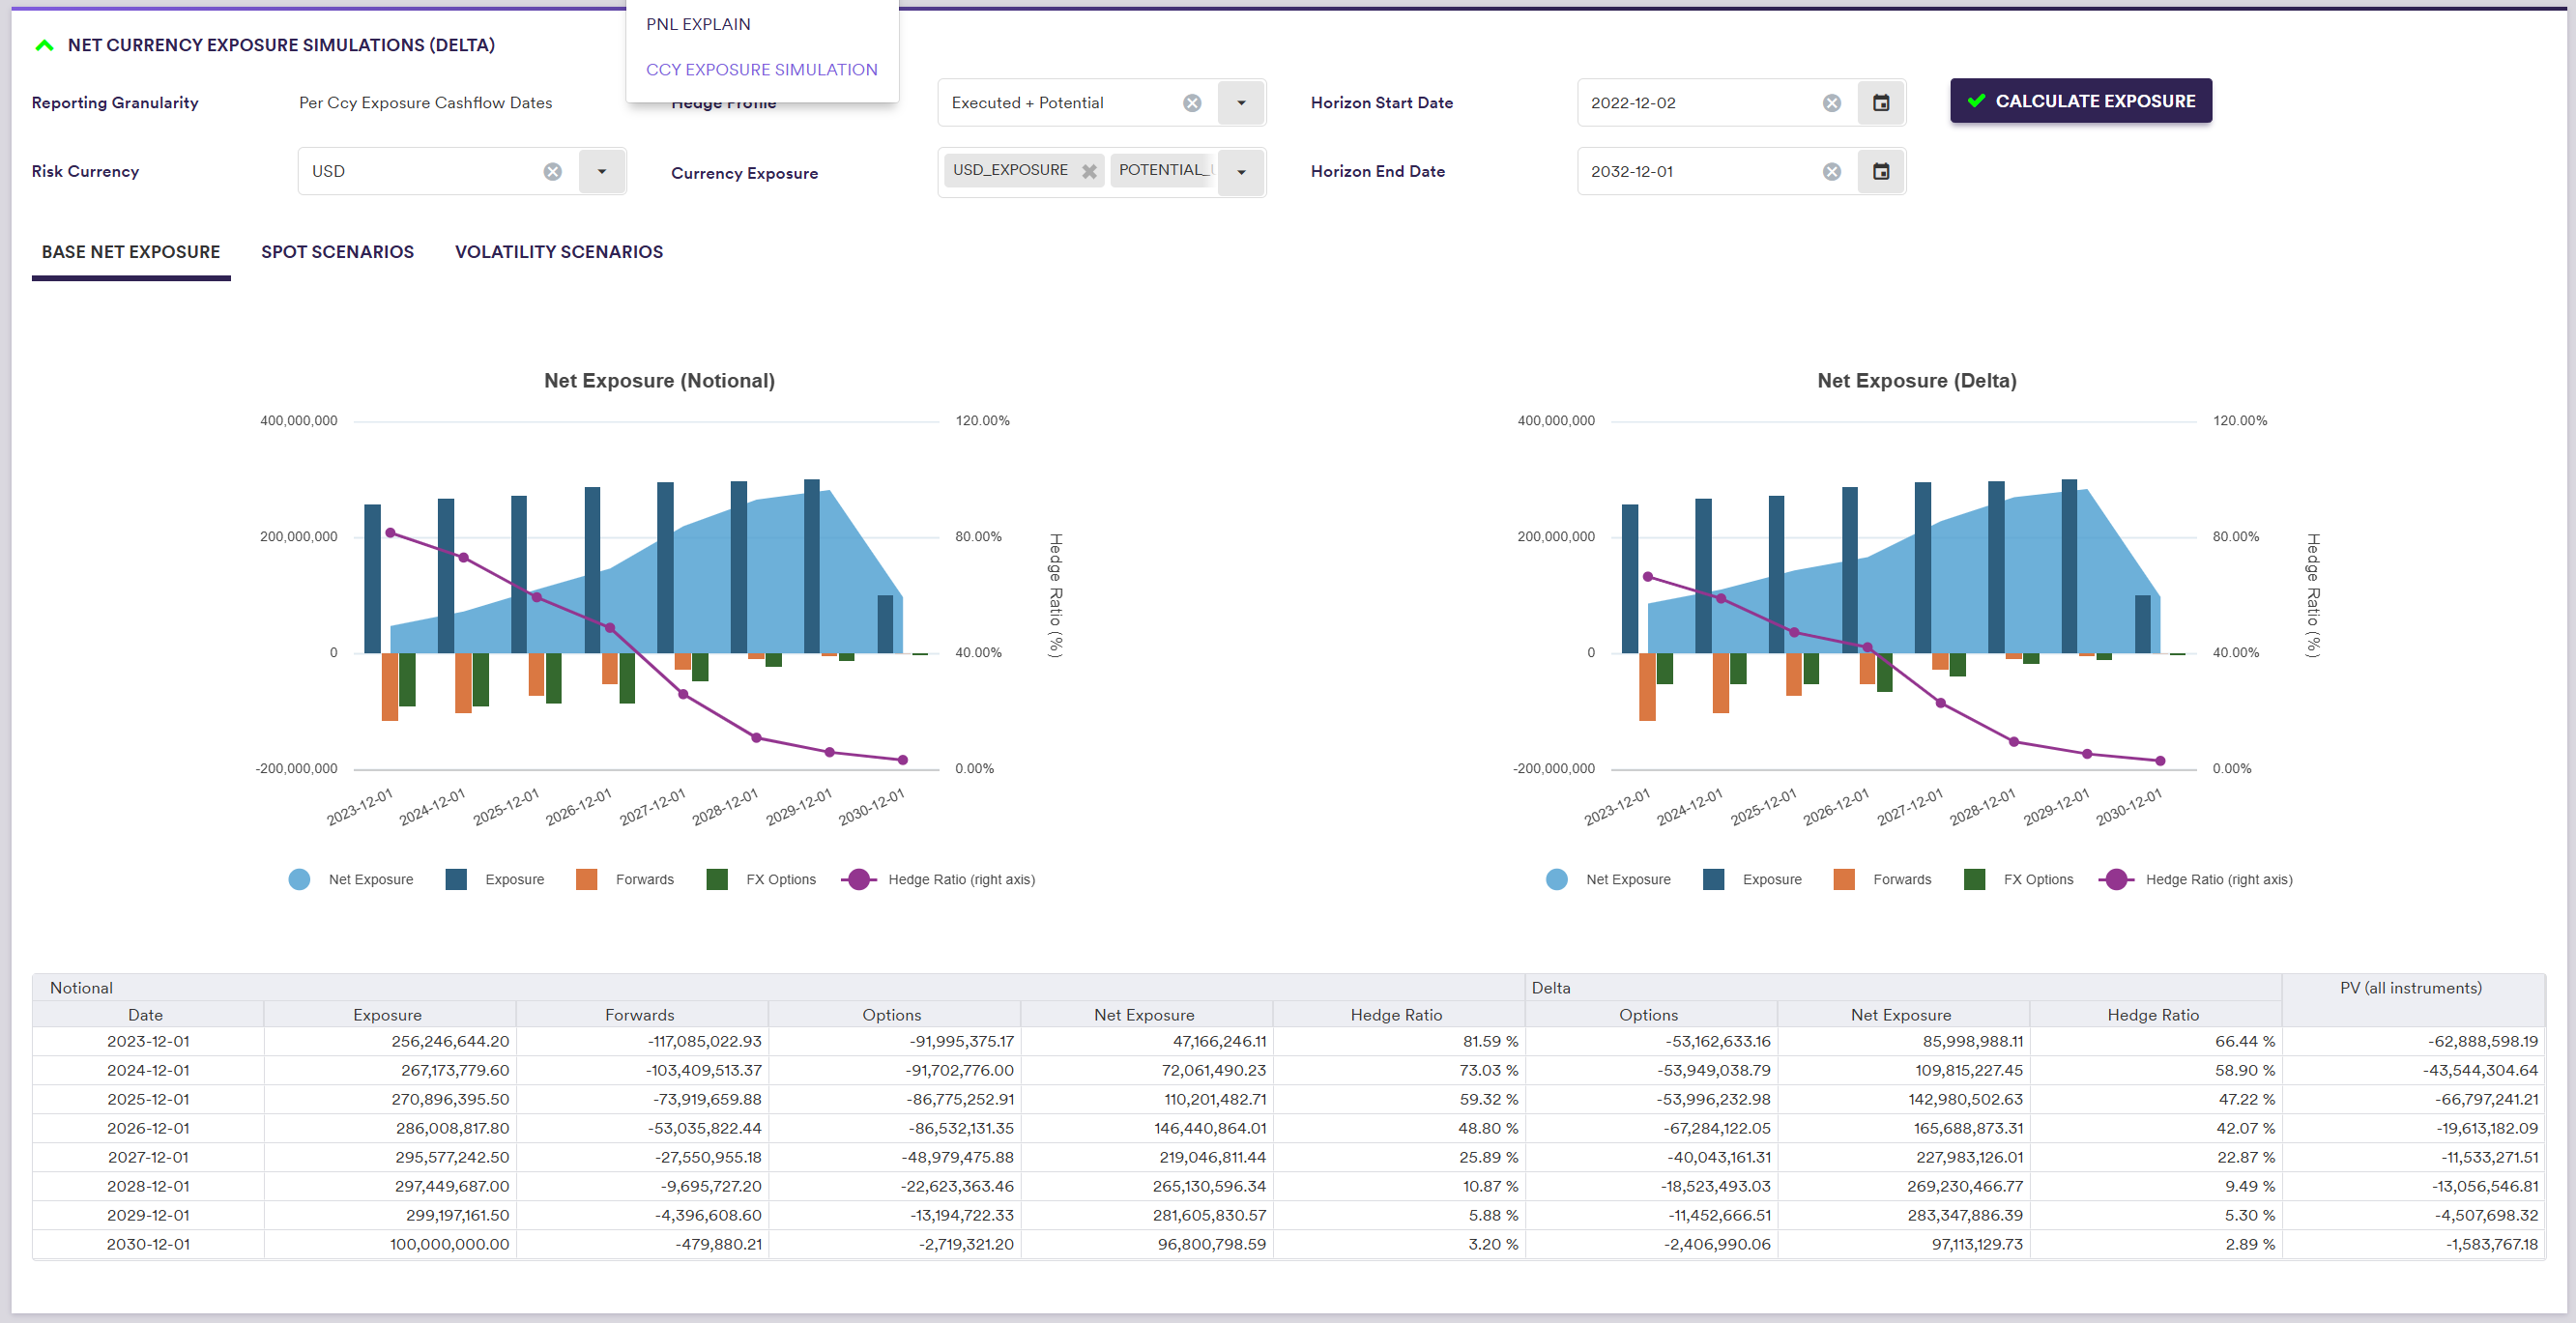
Base Net Currency Exposure Calculation Results
Under Base Net Exposure, you can view the base calculation results (i.e. with no shift applied), as described here).
You can also view Spot FX scenario results and FX volatility scenario results.
CCY EXPOSURE SIMULATION Results/My Simulations/BASE NET EXPOSURE
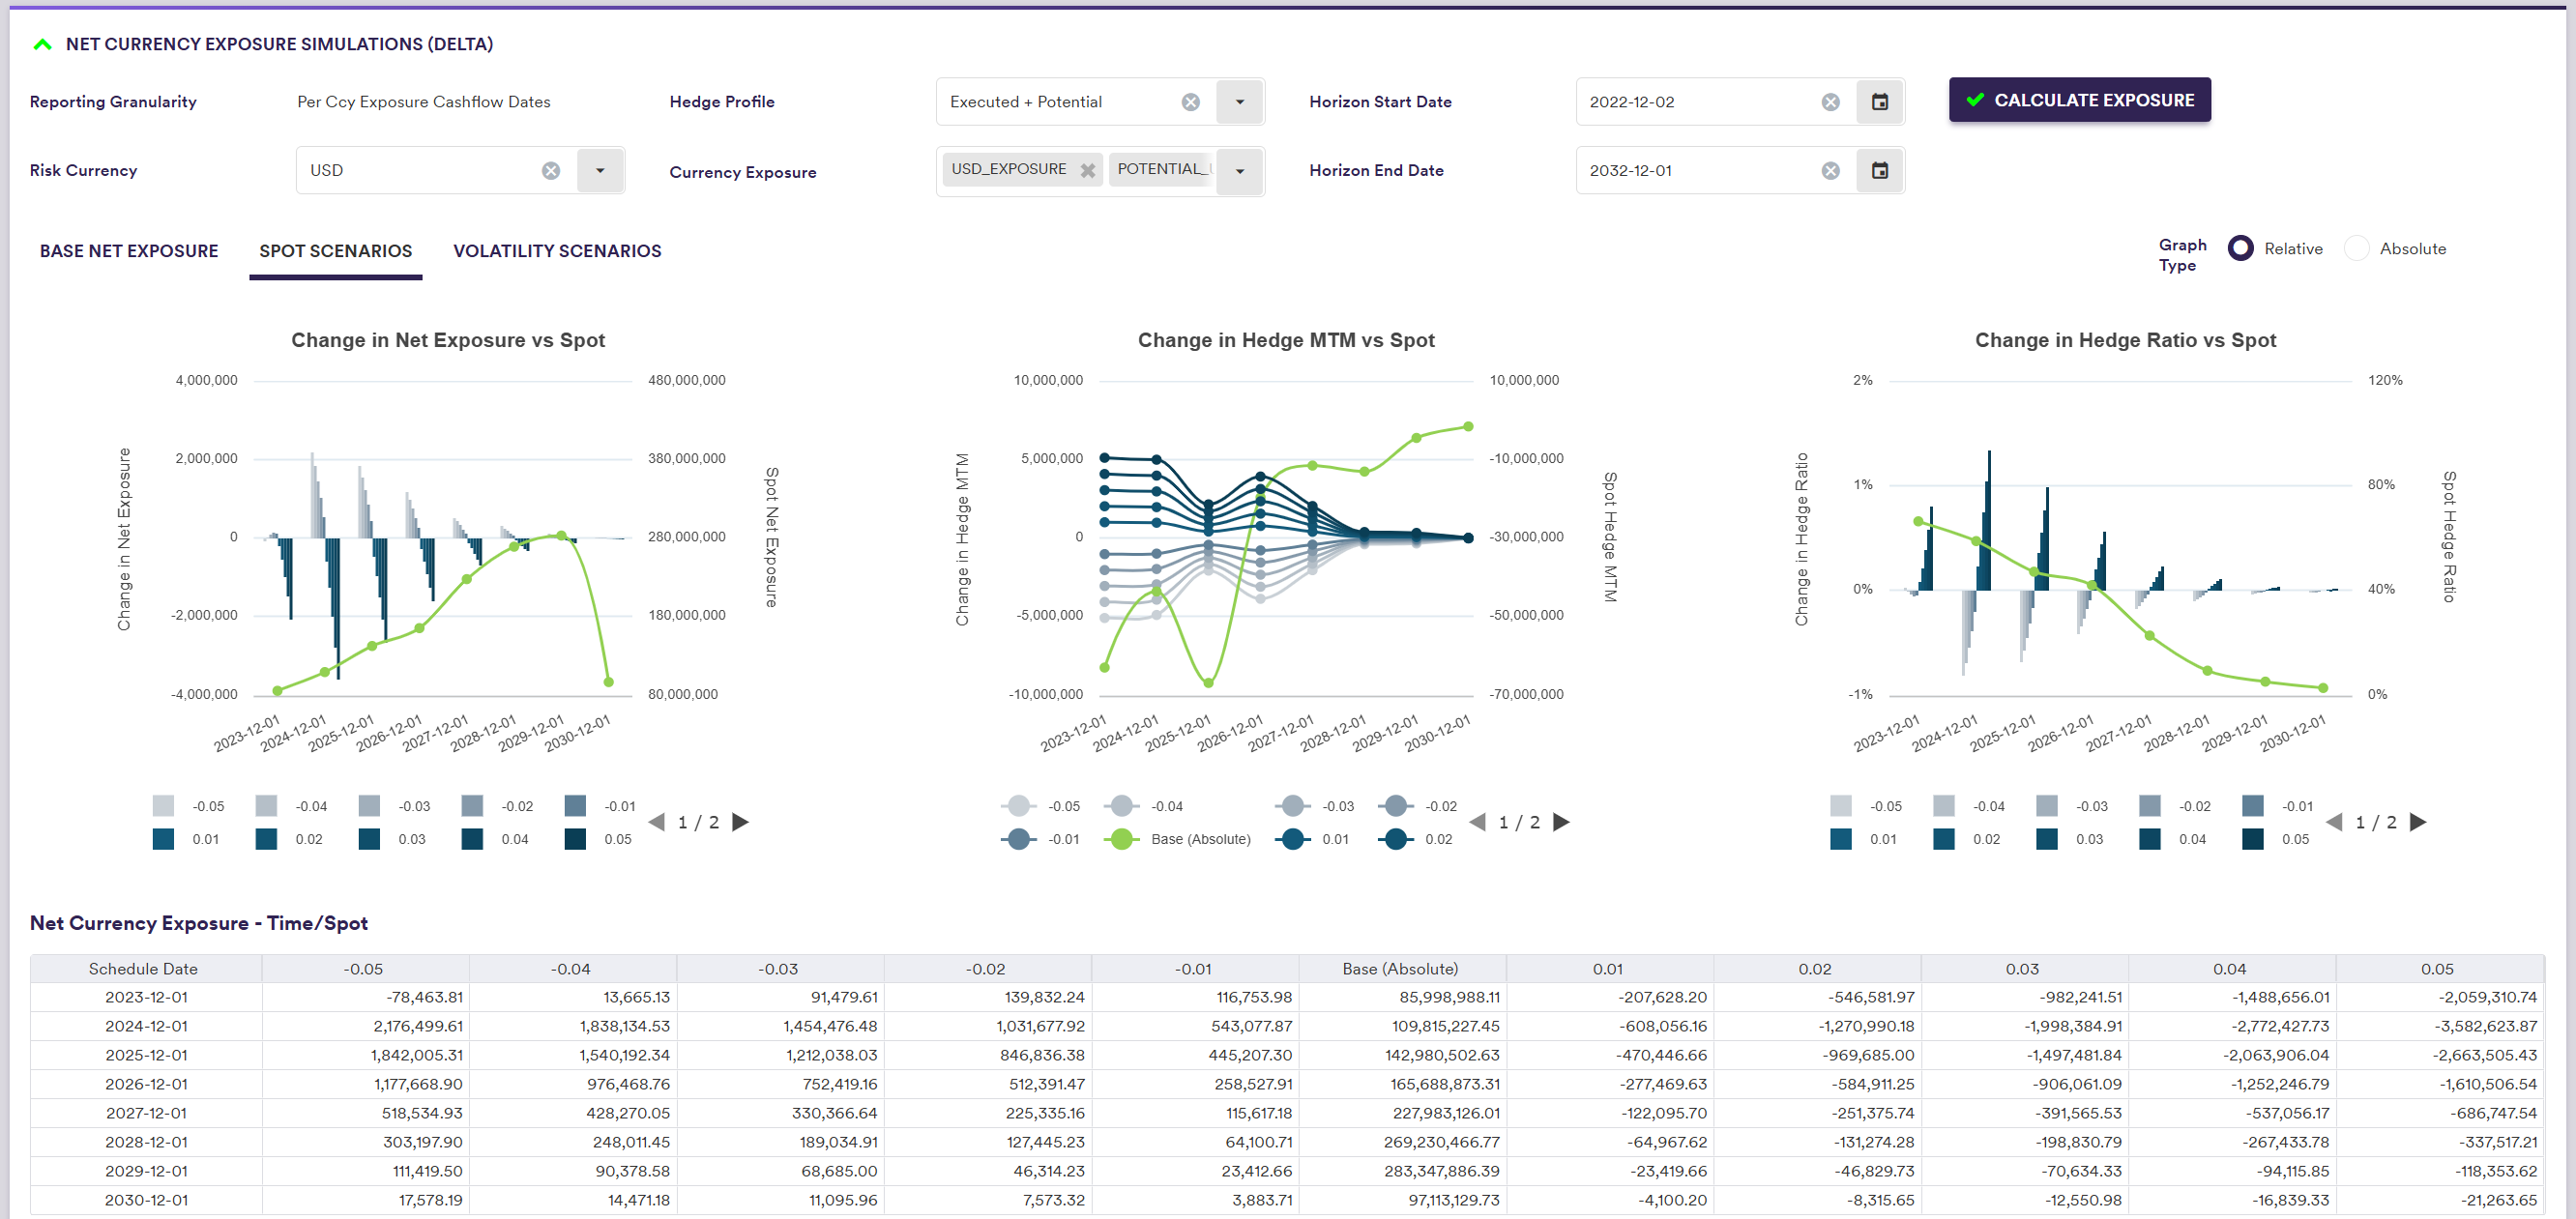
Spot FX Shift Simulation Results
Under Spot Scenarios, you can view the calculation results corresponding to the FX spot scenarios, on either a relative or absolute basis.
You can also view base results and FX volatility scenario results.
In each graph (net currency exposure, derivatives hedge mark-to-market and hedge ratio), the x-axis represents the cashflow dates and the y-axis represents the corresponding base values (i.e. with no shift applied), plotted in green for each cashflow date.
On a relative basis, the y-axis on the right correspond to the base values (line in green) and the y-axis on the left correspond to the change of value in repsect of each scenario(bars).
CCY EXPOSURE SIMULATION Results/My Simulations/SPOT SCENARIOS - RELATIVE BASIS
CCY EXPOSURE SIMULATION Results/My Simulations/SPOT SCENARIOS - ABSOLUTE BASIS
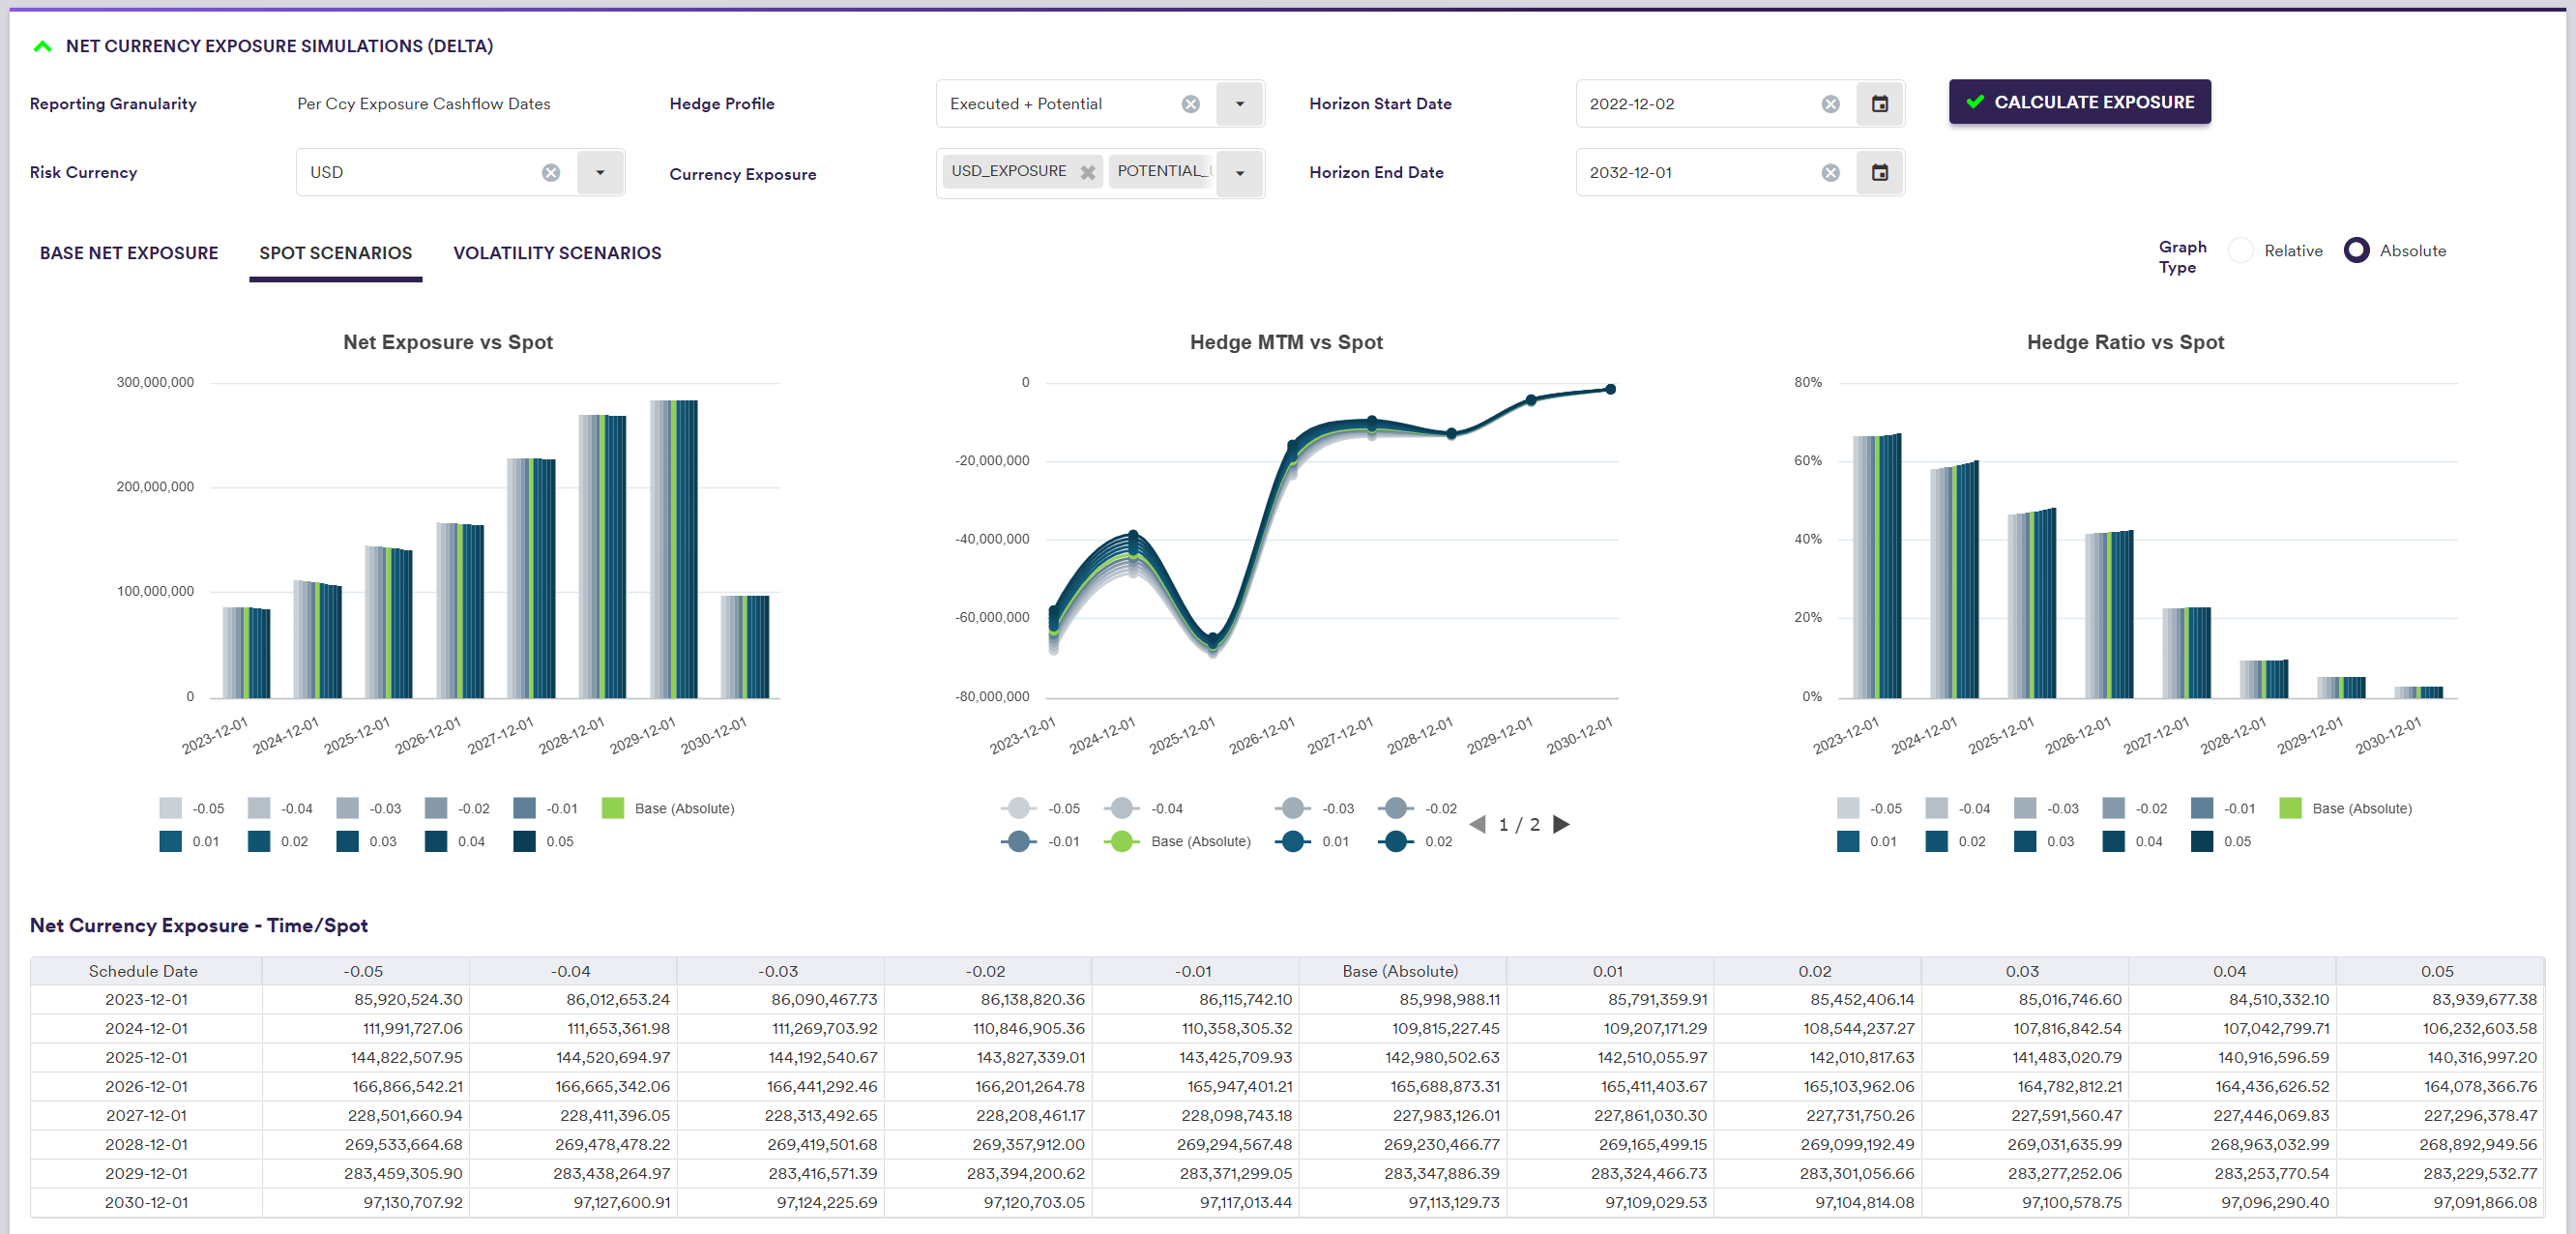
A description of the Spot FX simulation outputs is set out in the table below.
| Field Name | Description |
|---|---|
| Schedule Date | Cashflows between the previous Date (or Horizon Start Date) to this Date (included) will be taken into account |
| Base (Absolute) | Aggregated base values (i.e. with no Spot FX shift applied) in the relevant period |
| Spot FX shift applied (e.g. -0.05) |
Aggregated values in the relevant period, once the Spot FX shift has been applied. On a relative value, the base value will be deducted to the value after shift. |
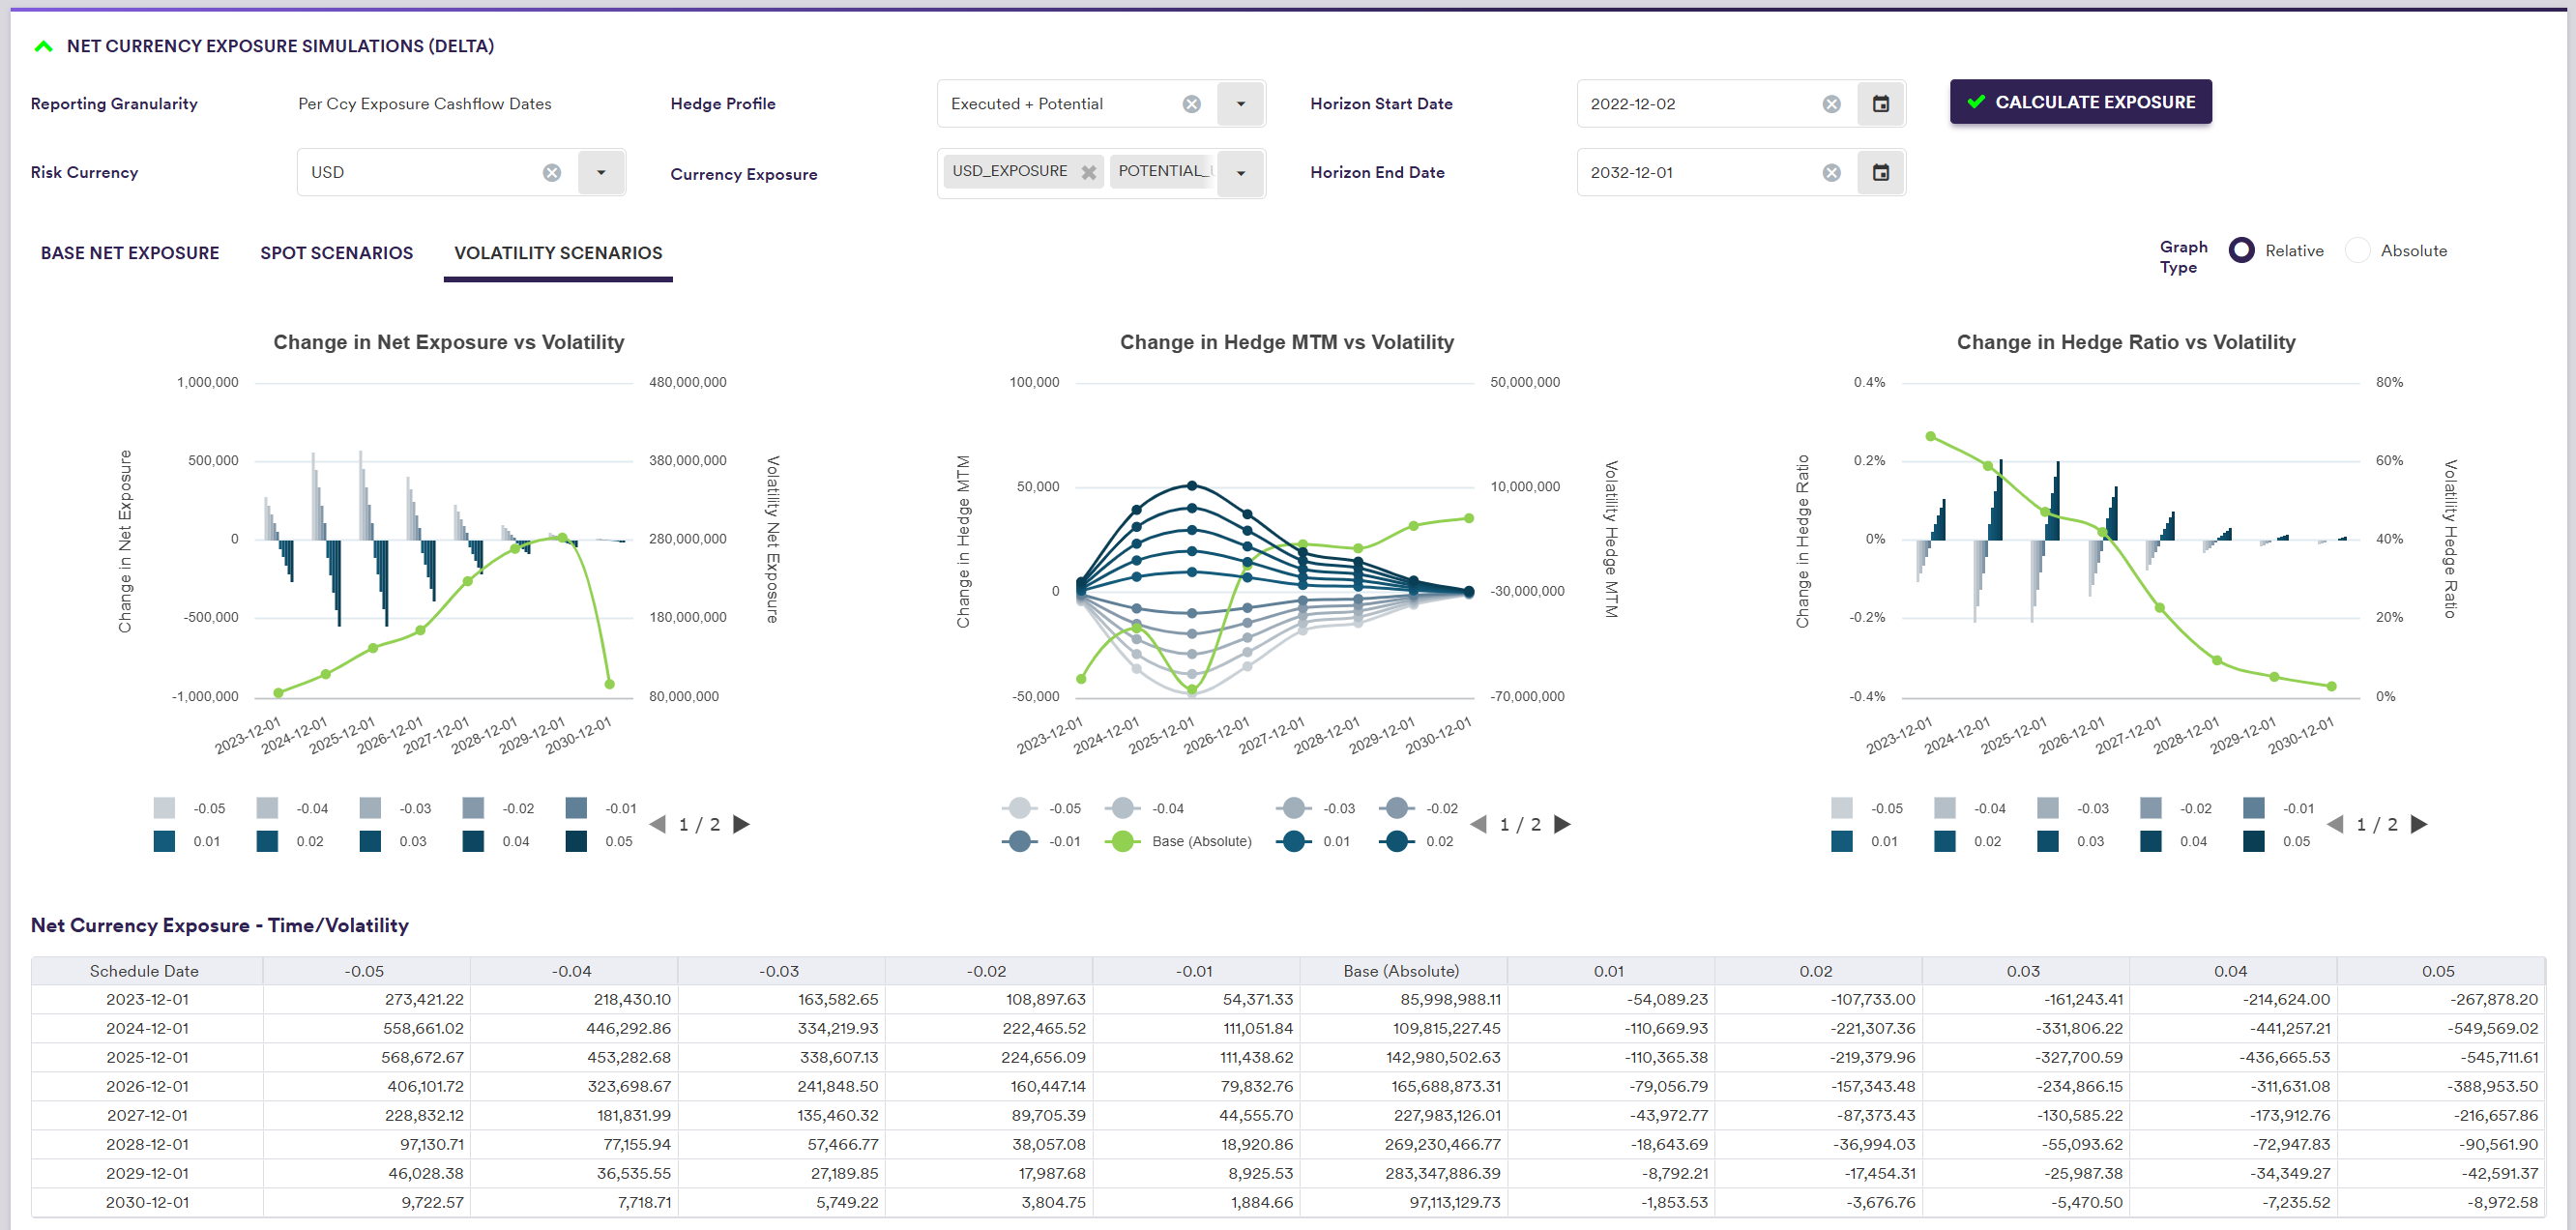
FX Volatility Shift Simulation Results
Under Volatility Scenarios, you can view the calculation results corresponding to the FX volatility scenarios, on either a relative or absolute basis.
You can also view base results and Spot FX scenario results.
In each graph (net currency exposure, derivatives hedge mark-to-market and hedge ratio), the x-axis represents the cashflow dates and the y-axis represents the corresponding base values (i.e. with no shift applied), plotted in green for each cashflow date.
On a relative basis, the y-axis on the right correspond to the base values (line in green) and the y-axis on the left correspond to the change of value in repsect of each scenario(bars).
CCY EXPOSURE SIMULATION Results/My Simulations/VOLATILITY SCENARIOS - RELATIVE BASIS
CCY EXPOSURE SIMULATION Results/My Simulations/VOLATILITY SCENARIOS - ABSOLUTE BASIS
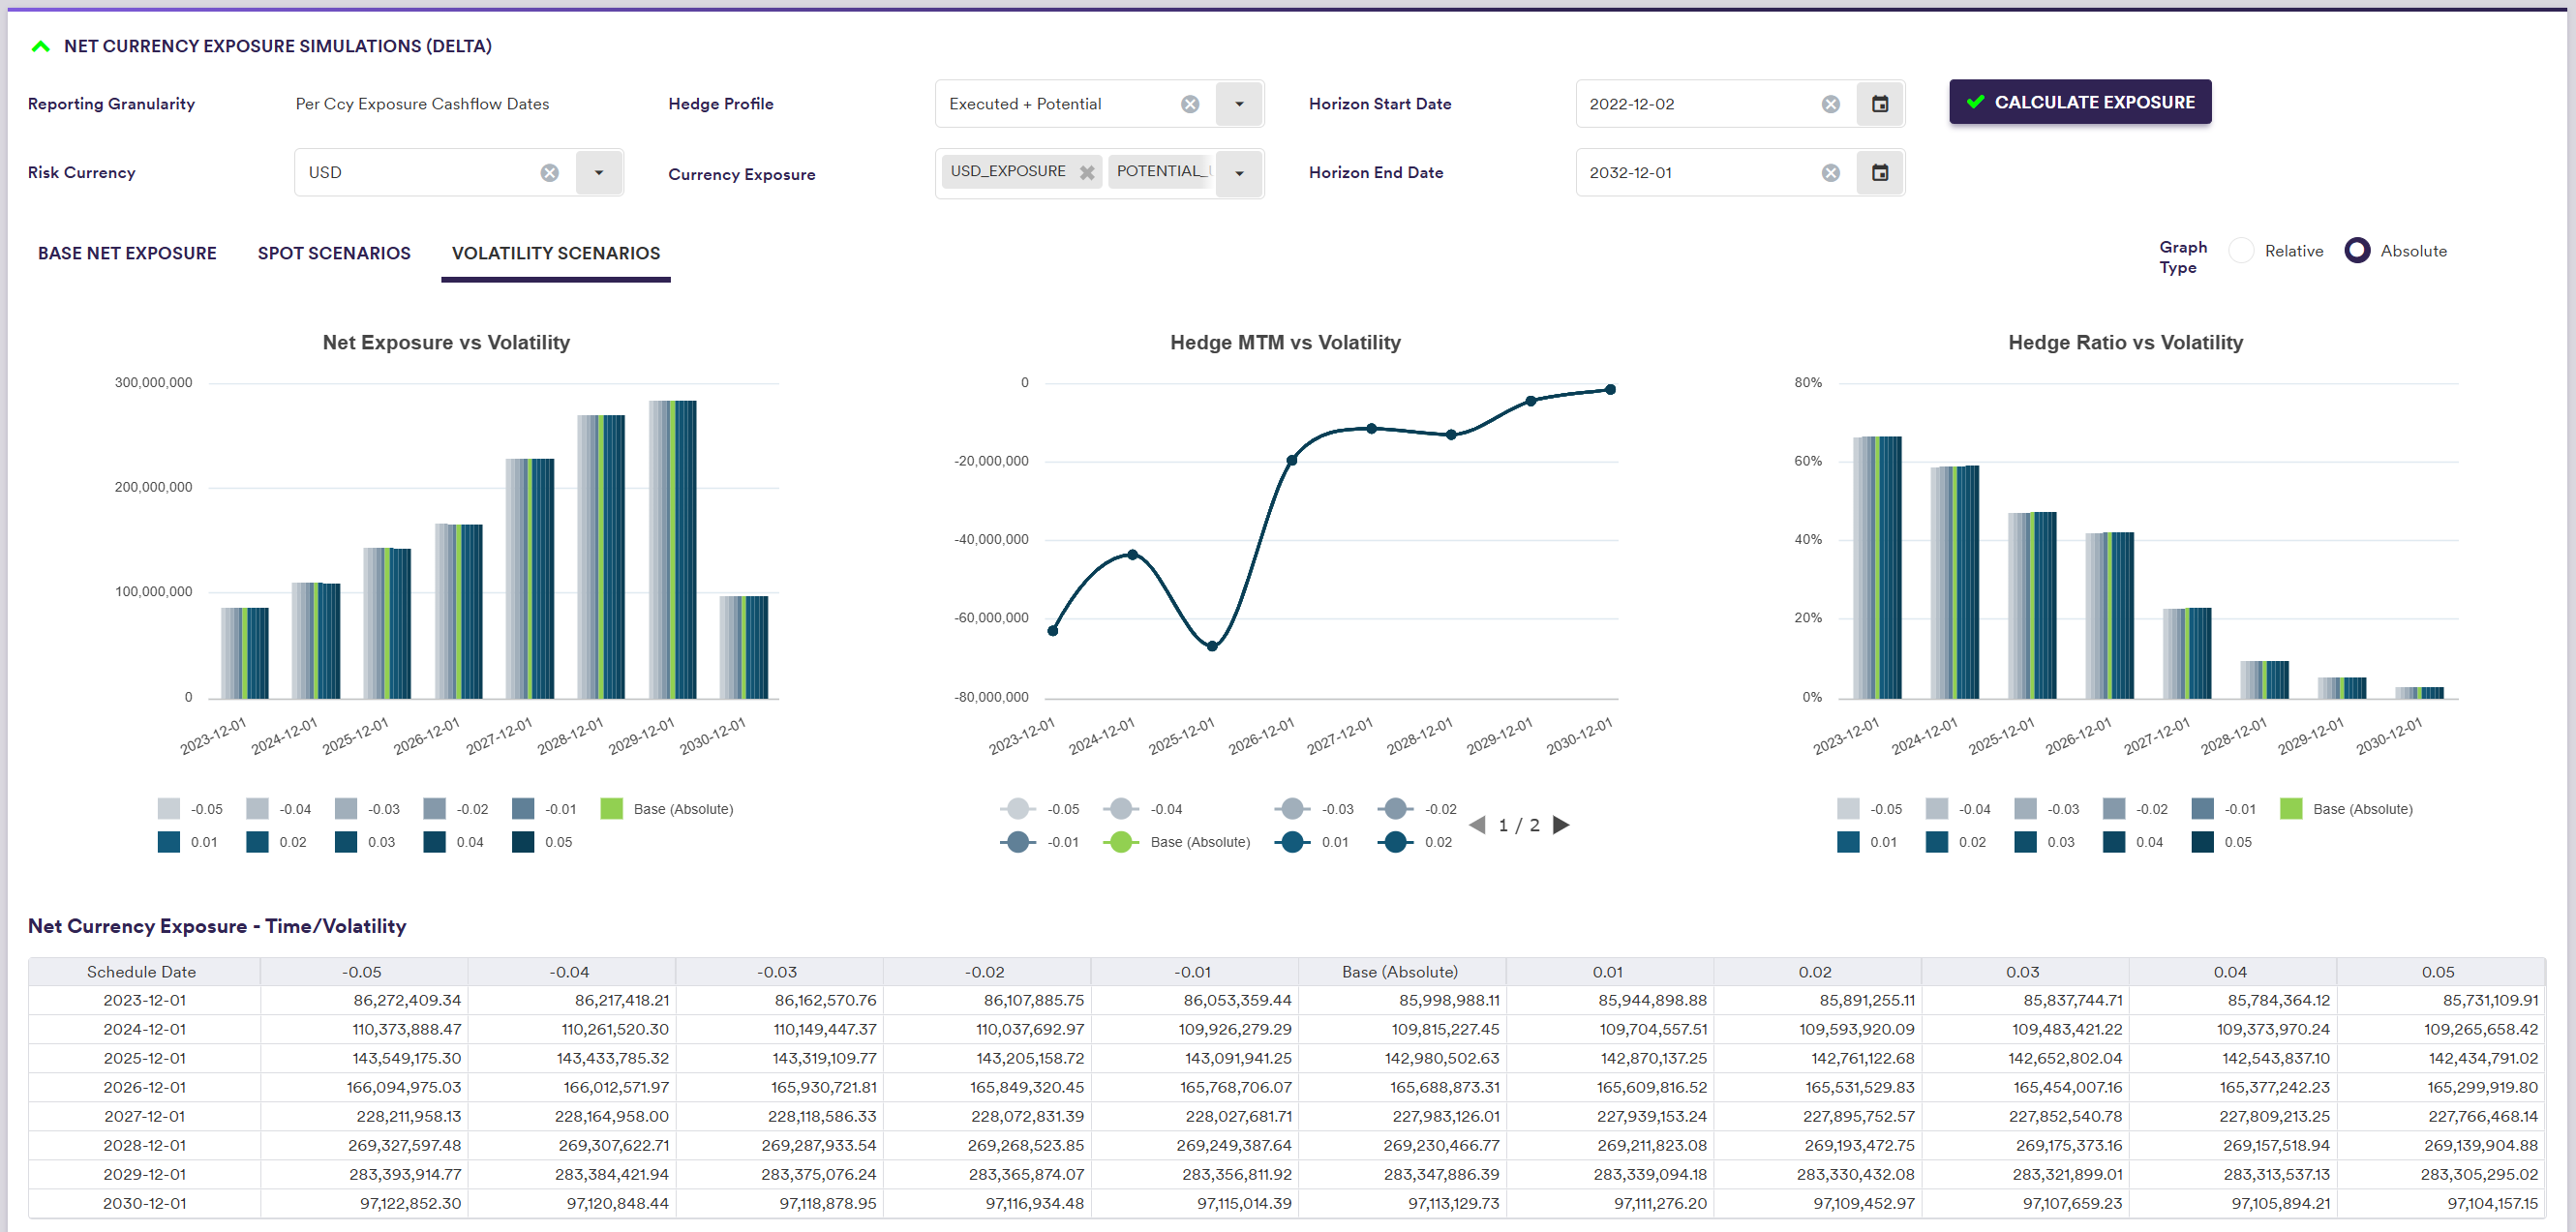
A description of the FX volatility simulation outputs is set out in the table below.
| Field Name | Description |
|---|---|
| Schedule Date | Cashflows between the previous Date (or Horizon Start Date) to this Date (included) will be taken into account |
| Base (Absolute) | Aggregated base values (i.e. with no FX volatility shift applied) in the relevant period |
| FX volatility shift applied (e.g. -0.05) |
Aggregated values in the relevant period, once the FX volatility shift has been applied. On a relative value, the base value will be deducted to the value after shift. |
The underlying calculations used for net currency exposure simulations can be found under