Break tests are applied to identify potential data outliers in our data anomaly detection process. You will be able to define a variety of bespoke break tests, with the relevant thresholds and applicability (e.g. asset class, currency, trade type), and potential tenor overrides (i.e. different thresholds). We also have the concept of a ‘child test’ which can be set up to not trigger breaks on a standalone basis (e.g. day-on-day move), but only under certain conditions, when say the magnitude is different from one source to another.
The types of break tests in Xplain are:
- market data break tests
- valuation data break tests, for which you will need to specify the currency in which third-party valuation data is reported
We also have a similar concept of break test for new trade onboarding, where a report is generated to identify potential trade misbooking (without a two-stage resolution process).
1. Break Tests for Market Data
Break tests for market data can be classified into two categories which will be applied in the following order:
- preliminary break tests, to assist in identifying outliers on a standalone basis
- overlay break tests, applied on preliminary cleaned data, to assist in identifying outliers by comparing two sets of data (day-on-day, source-to-source, or day-on-dayby reference to historical (joint) distribution, e.g. ‘Z-score’ test)
Preliminary break tests include a ‘NULL’ test which you cannot disable. They can be applied on a single curve date or on a set of curve dates (which can be useful for batch cleaning of historical data).
Overlay break tests can be defined with up to three different break thresholds (to prioritise the severity level).
Break test definitions for market data are described in the tables below, with the following conventions:
- P(t,i), i = 1 (primary provider) or 2 (secondary provider)
- ΔP(t,i) = P(t,i) - P(t-1,i)
- For day-on-day overlay break tests, the waterfall to determine P(t-1,i) will be: overlay value -> preliminary value -> raw value
- For source-to-source overlay break tests, the waterfall to determine P(t,i) will be: preliminary value -> raw value
If an overlay break test calculation can not be performed due to a missing raw market data value, this will not trigger a break however, the number of “skipped” tests will be reported in the dashboard.
Overlay day-on-day break tests will only be applied to data in respect of the primary provider, unless used as a child break test (see below).
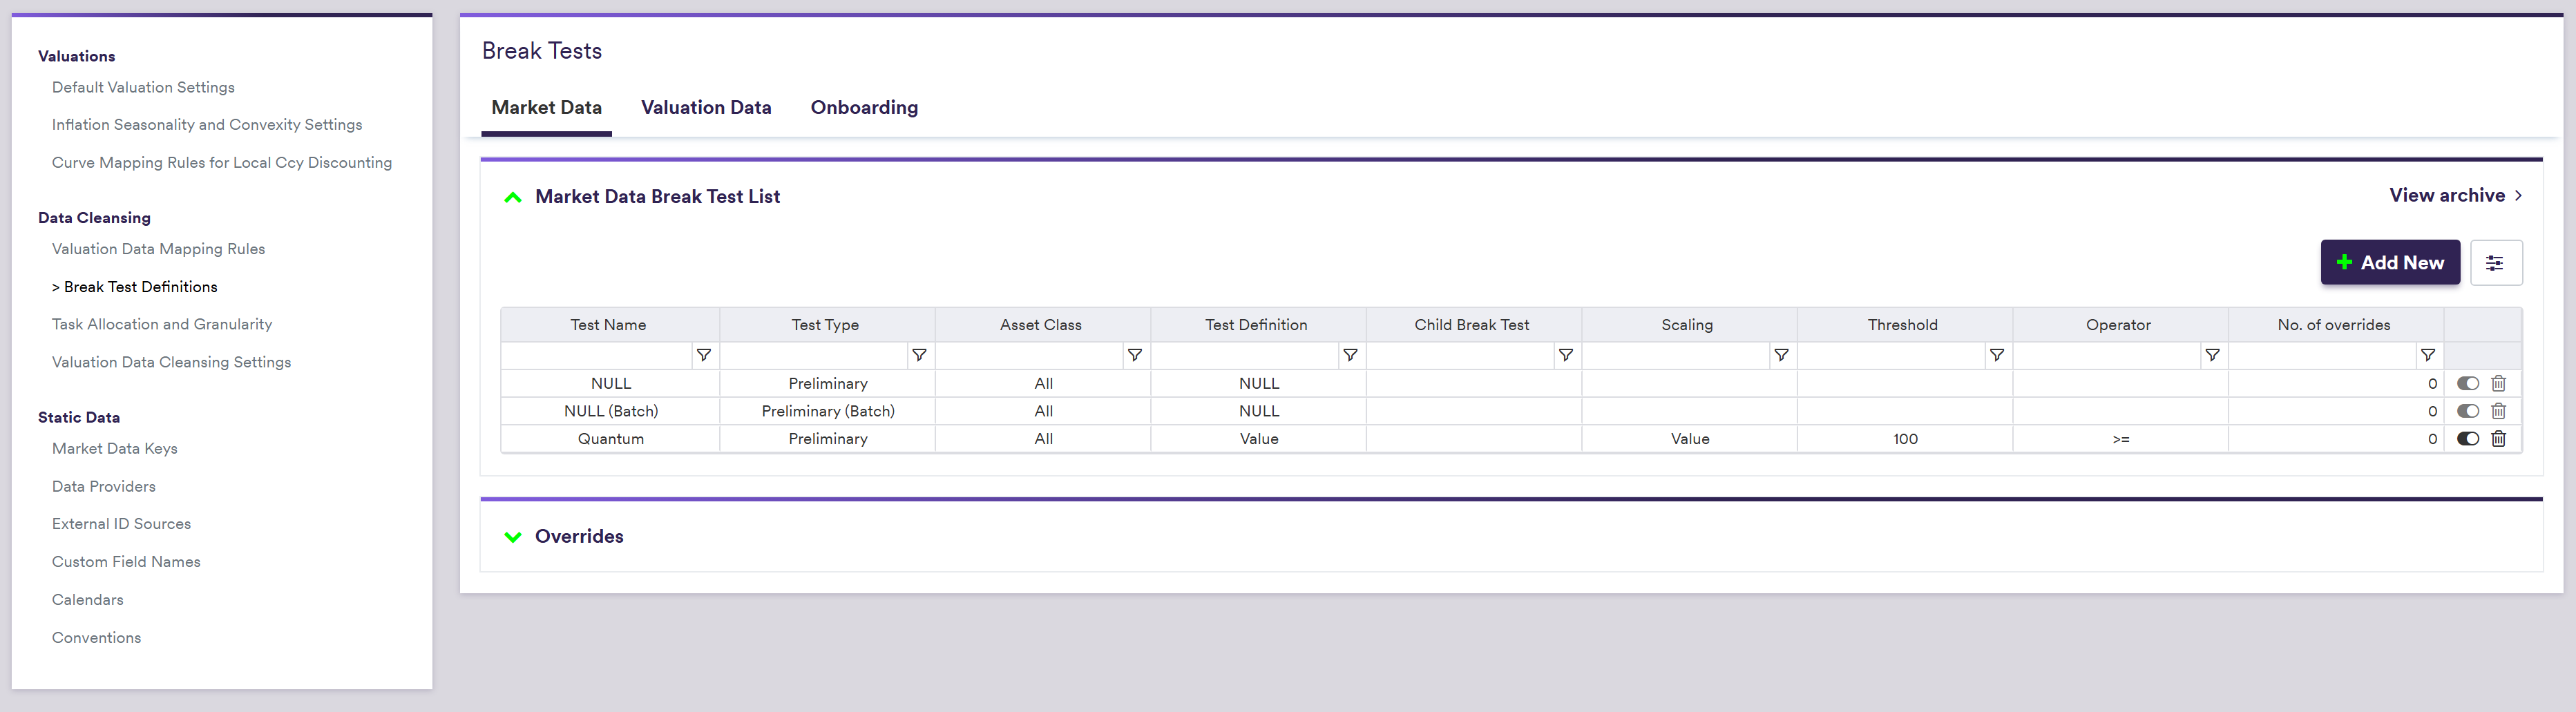
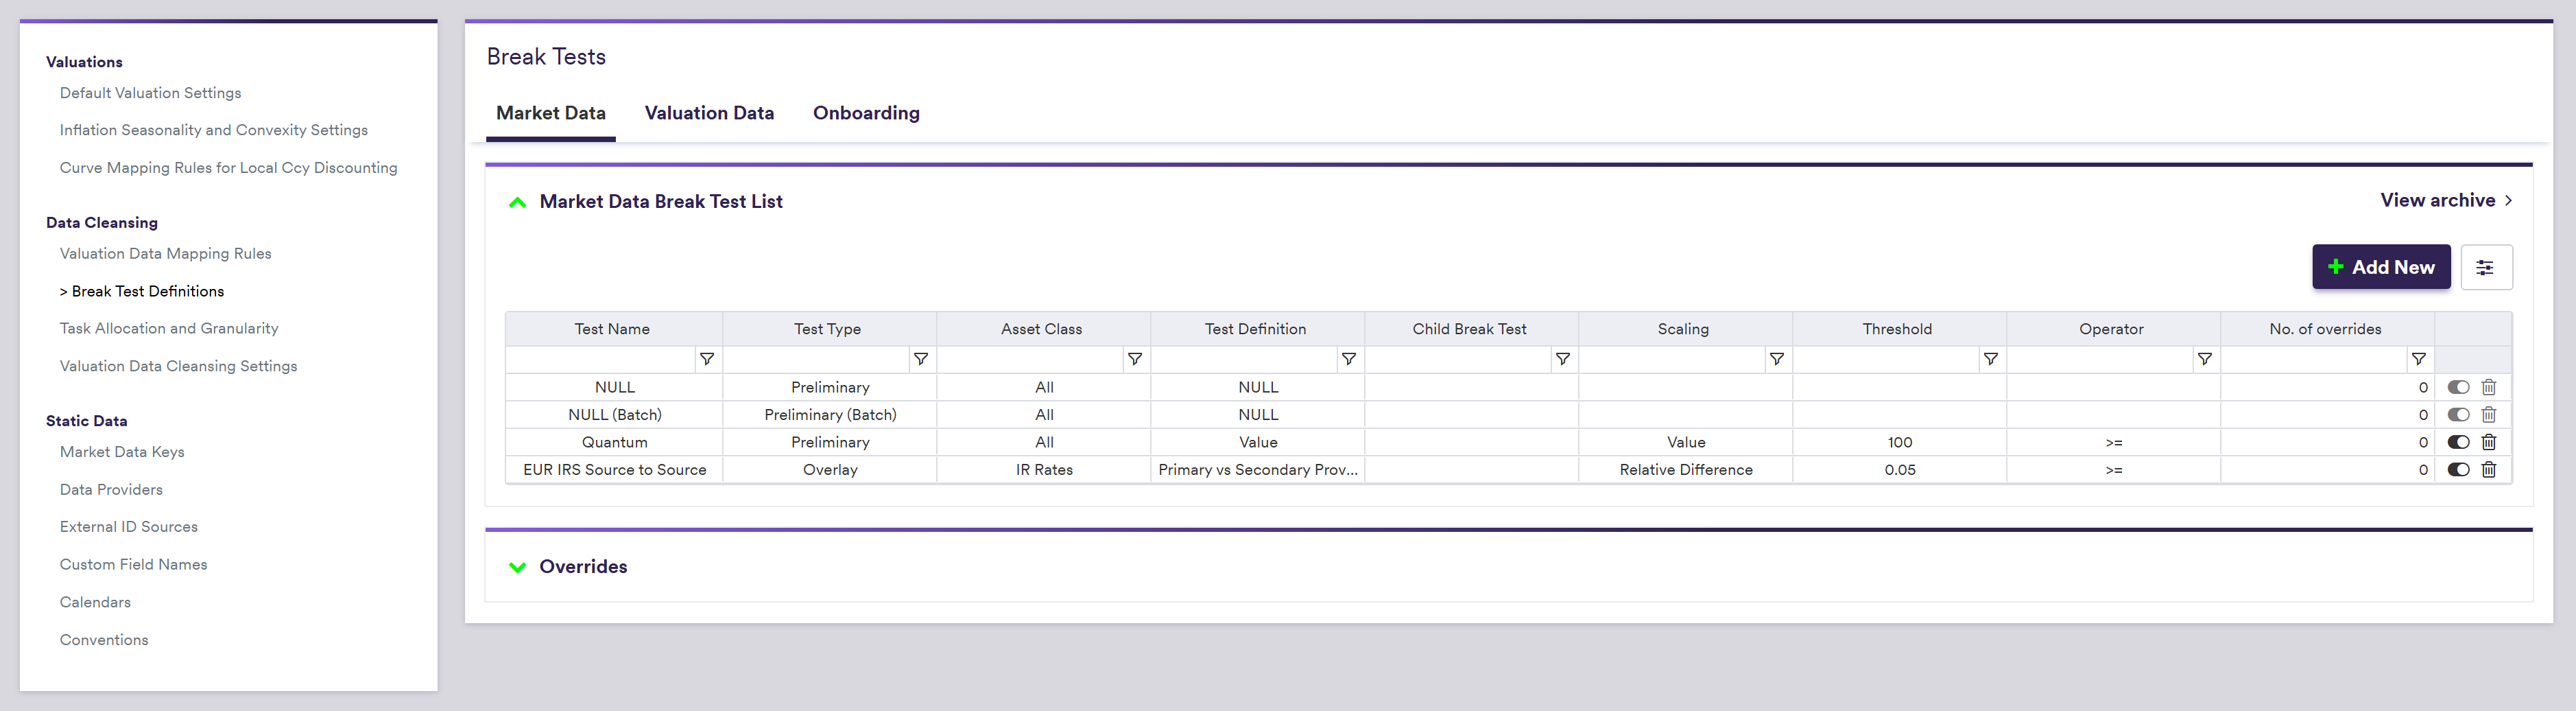
In our sandbox environment, in addition to the NULL test that cannot be disabled, we have predefined the following tests:
- A Quantum preliminary break test, which triggers a break when the data value is above 100
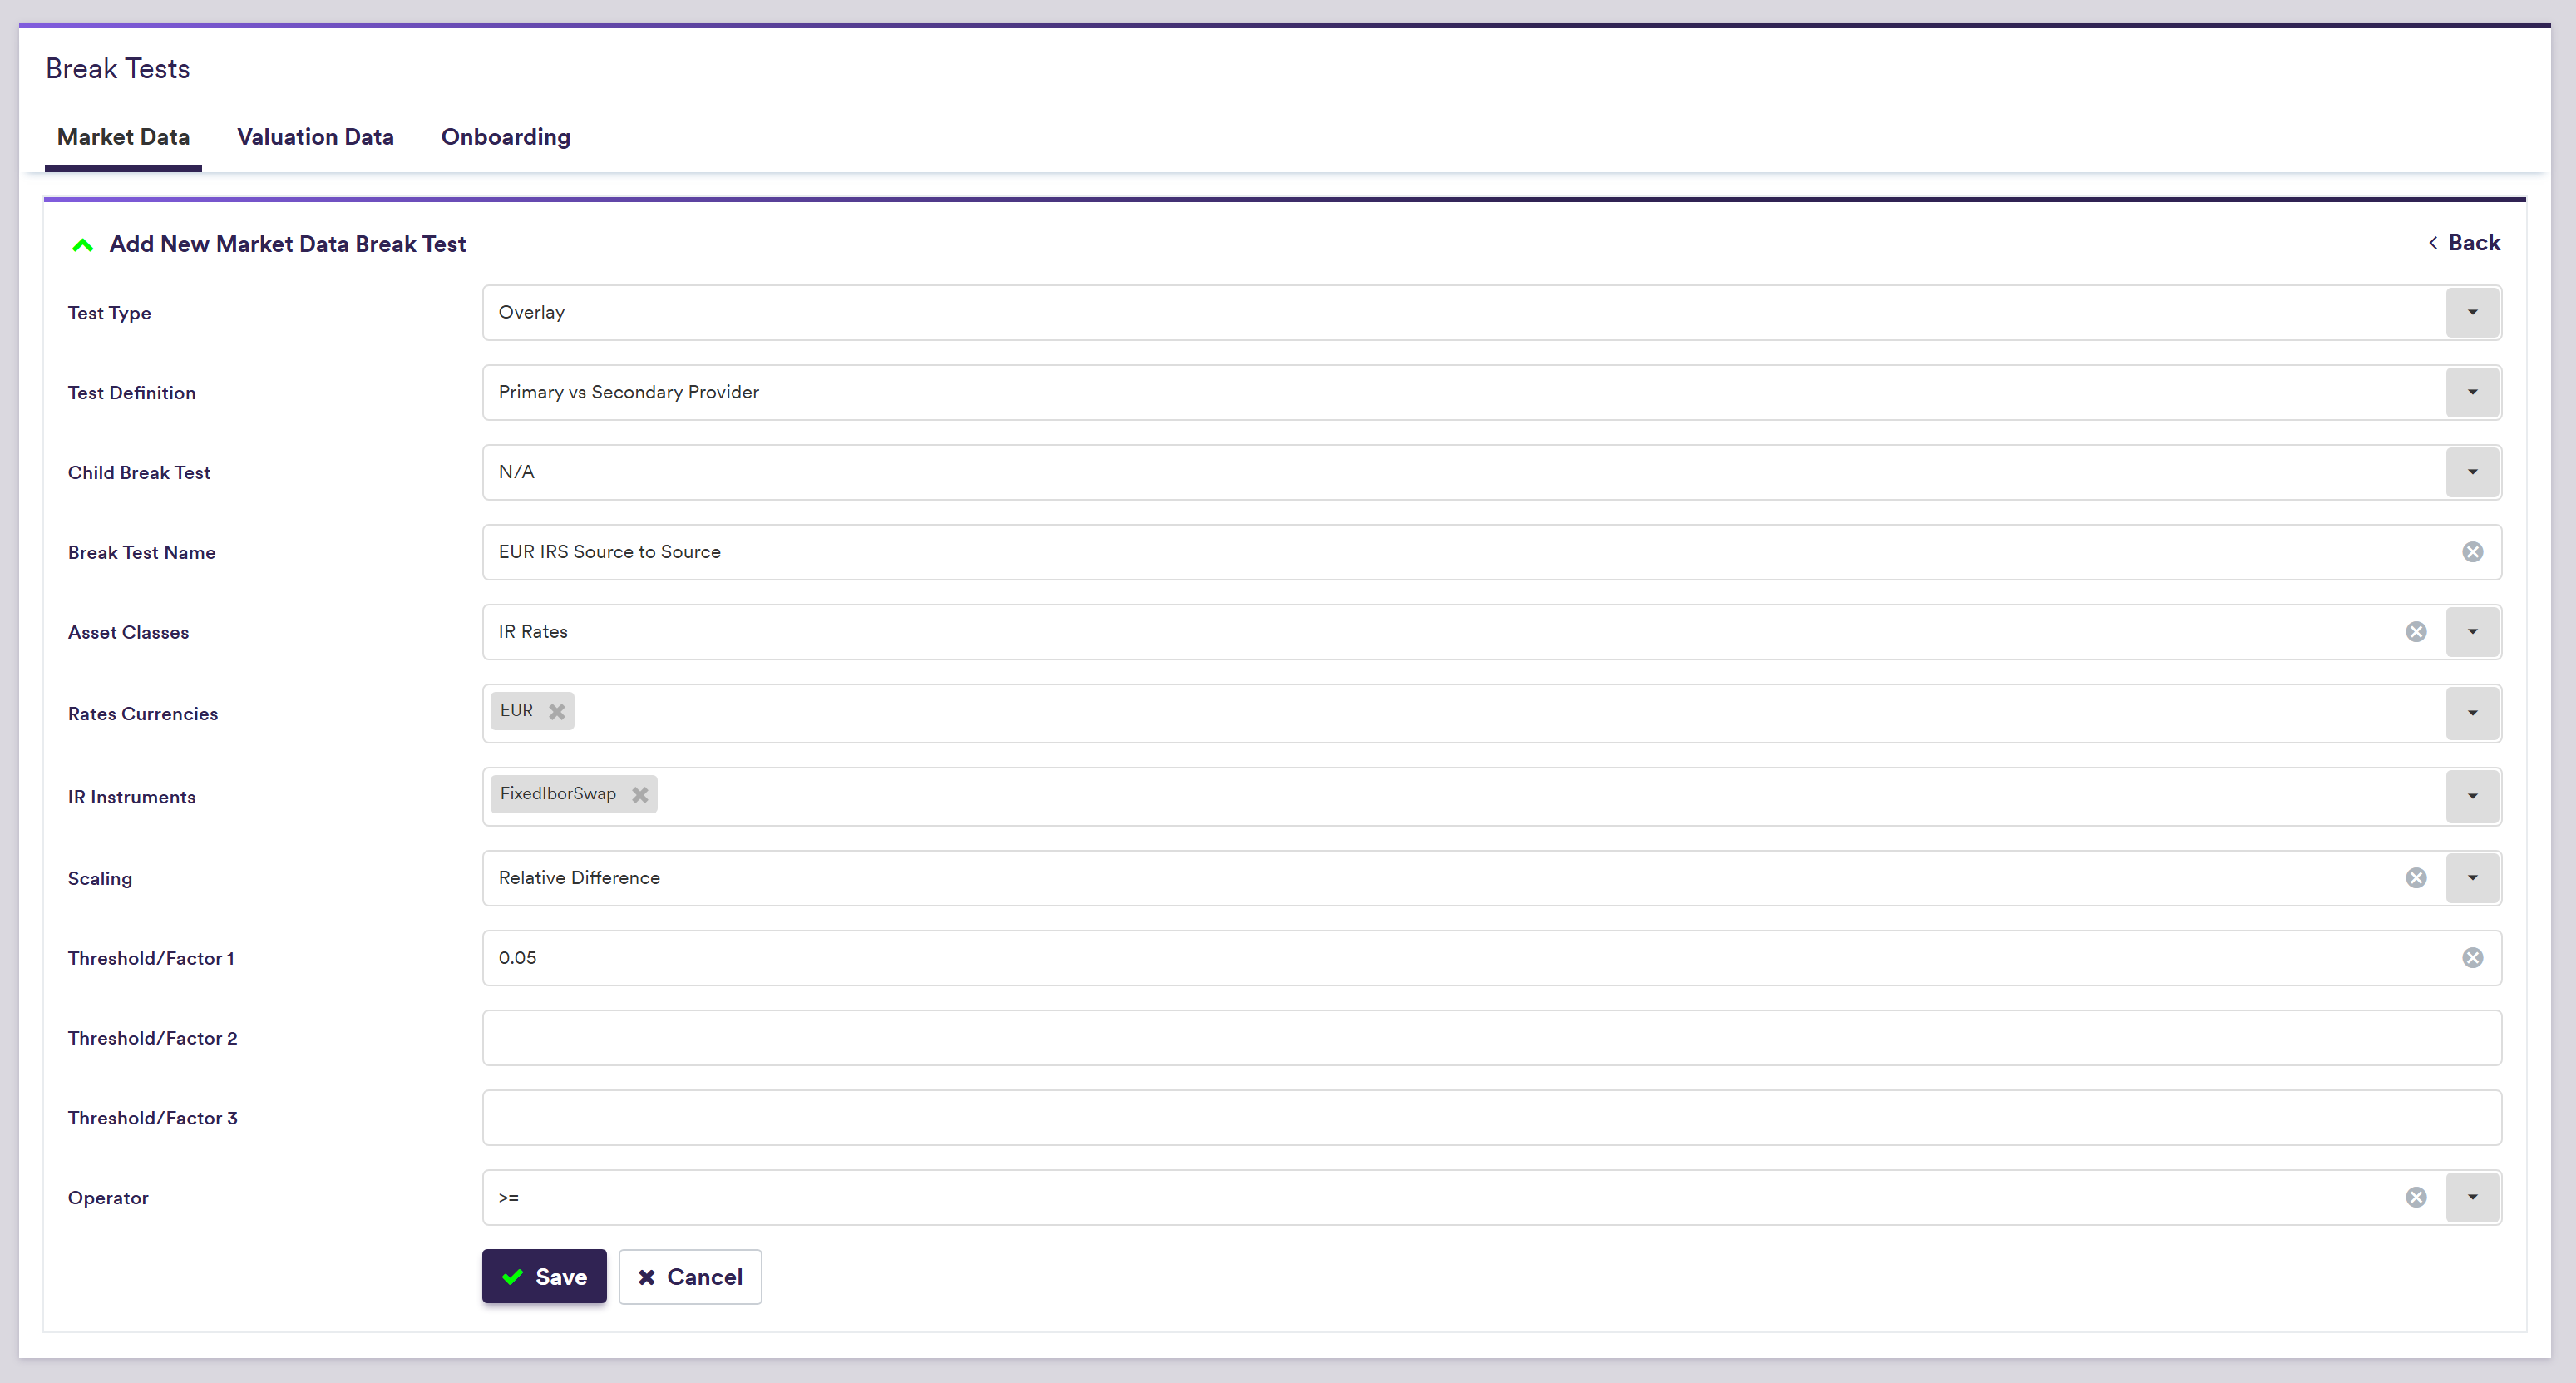
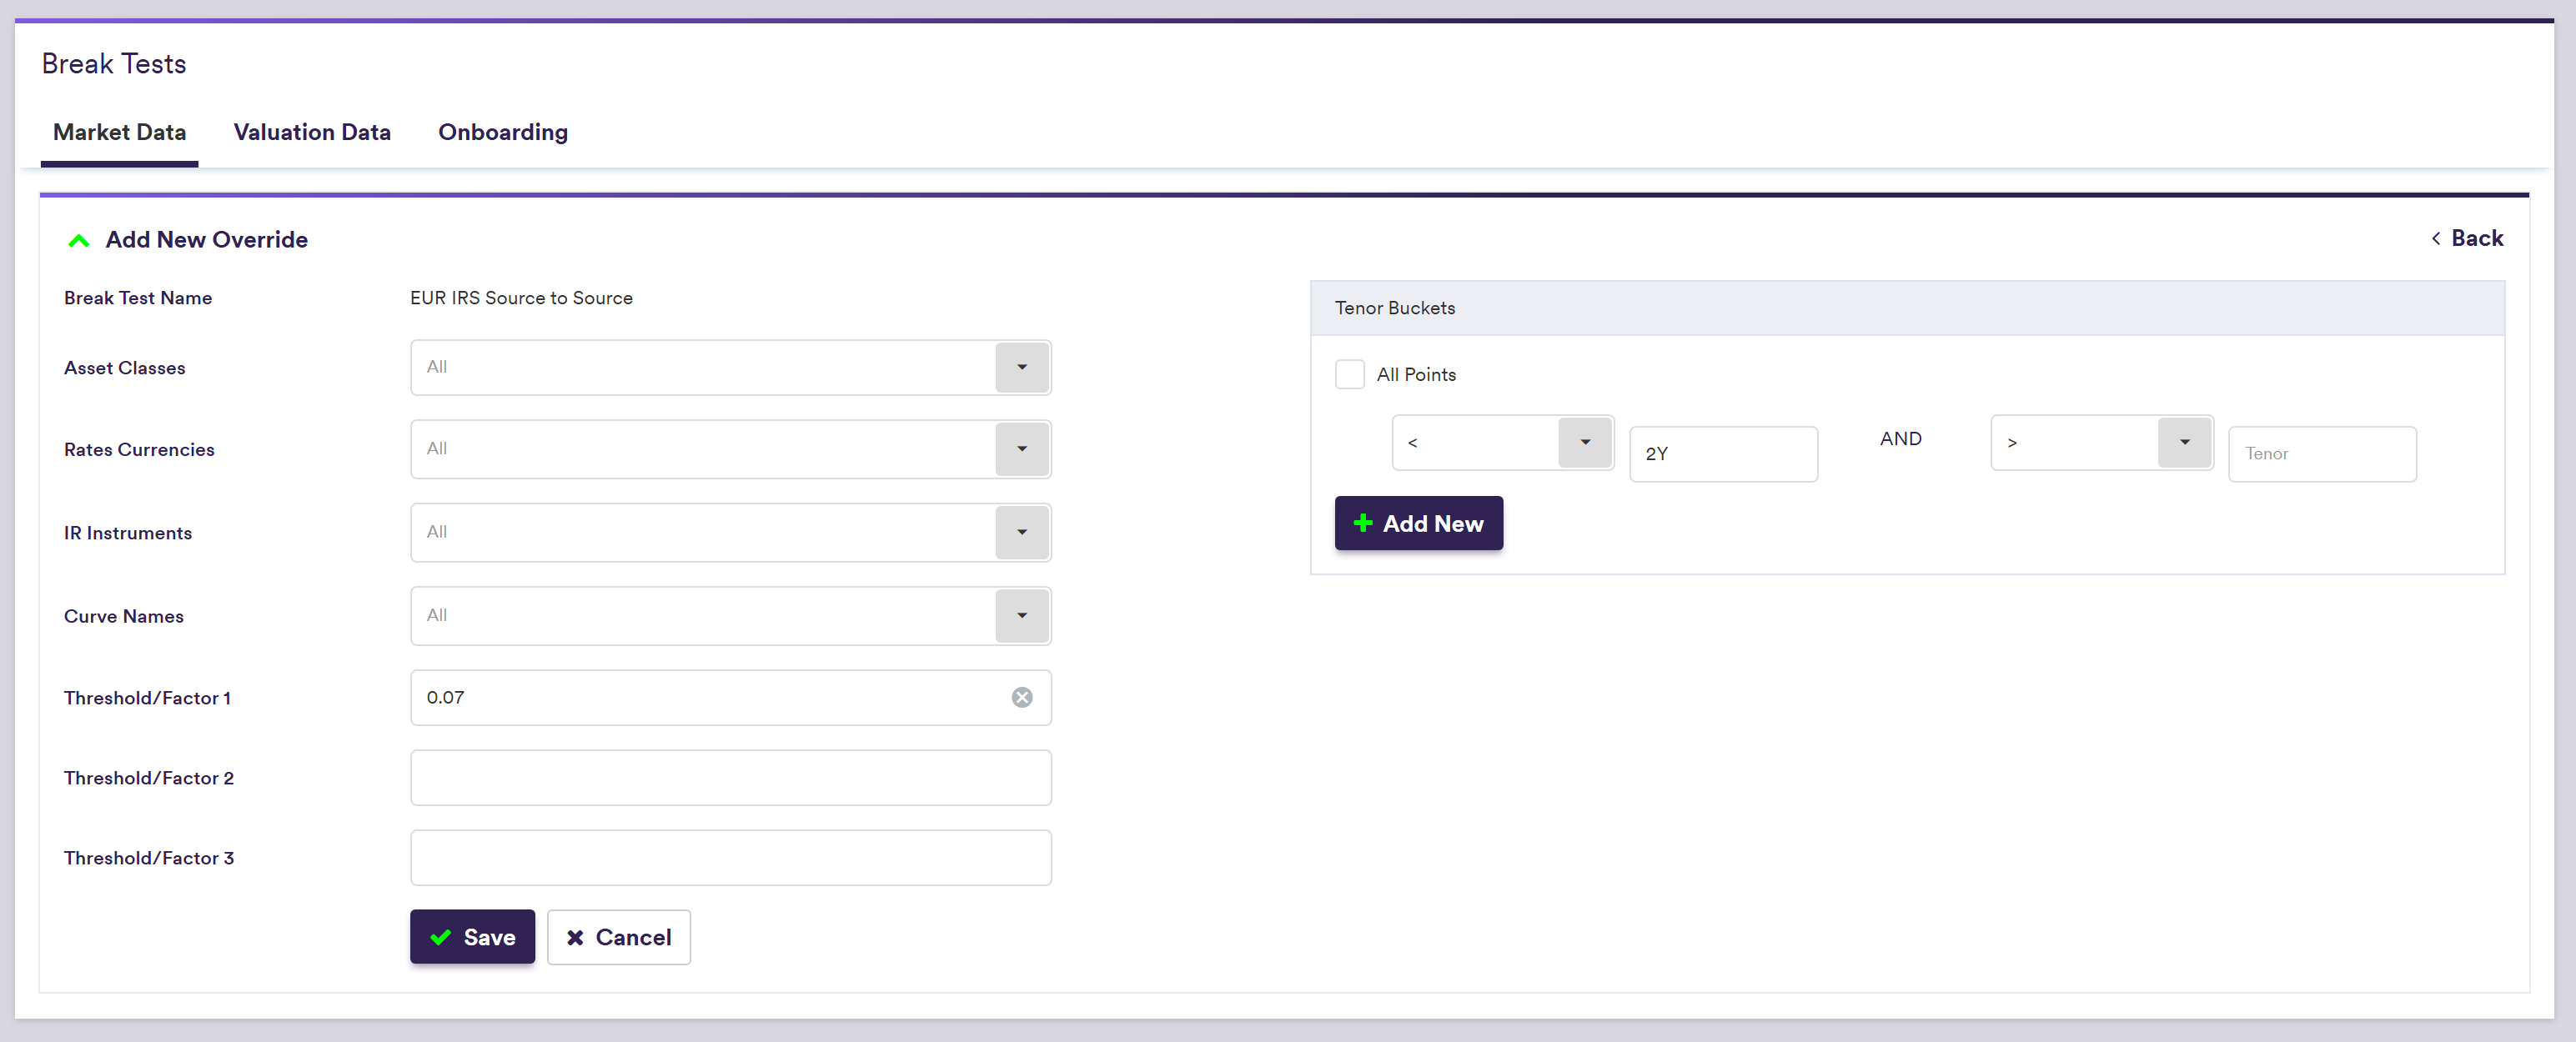
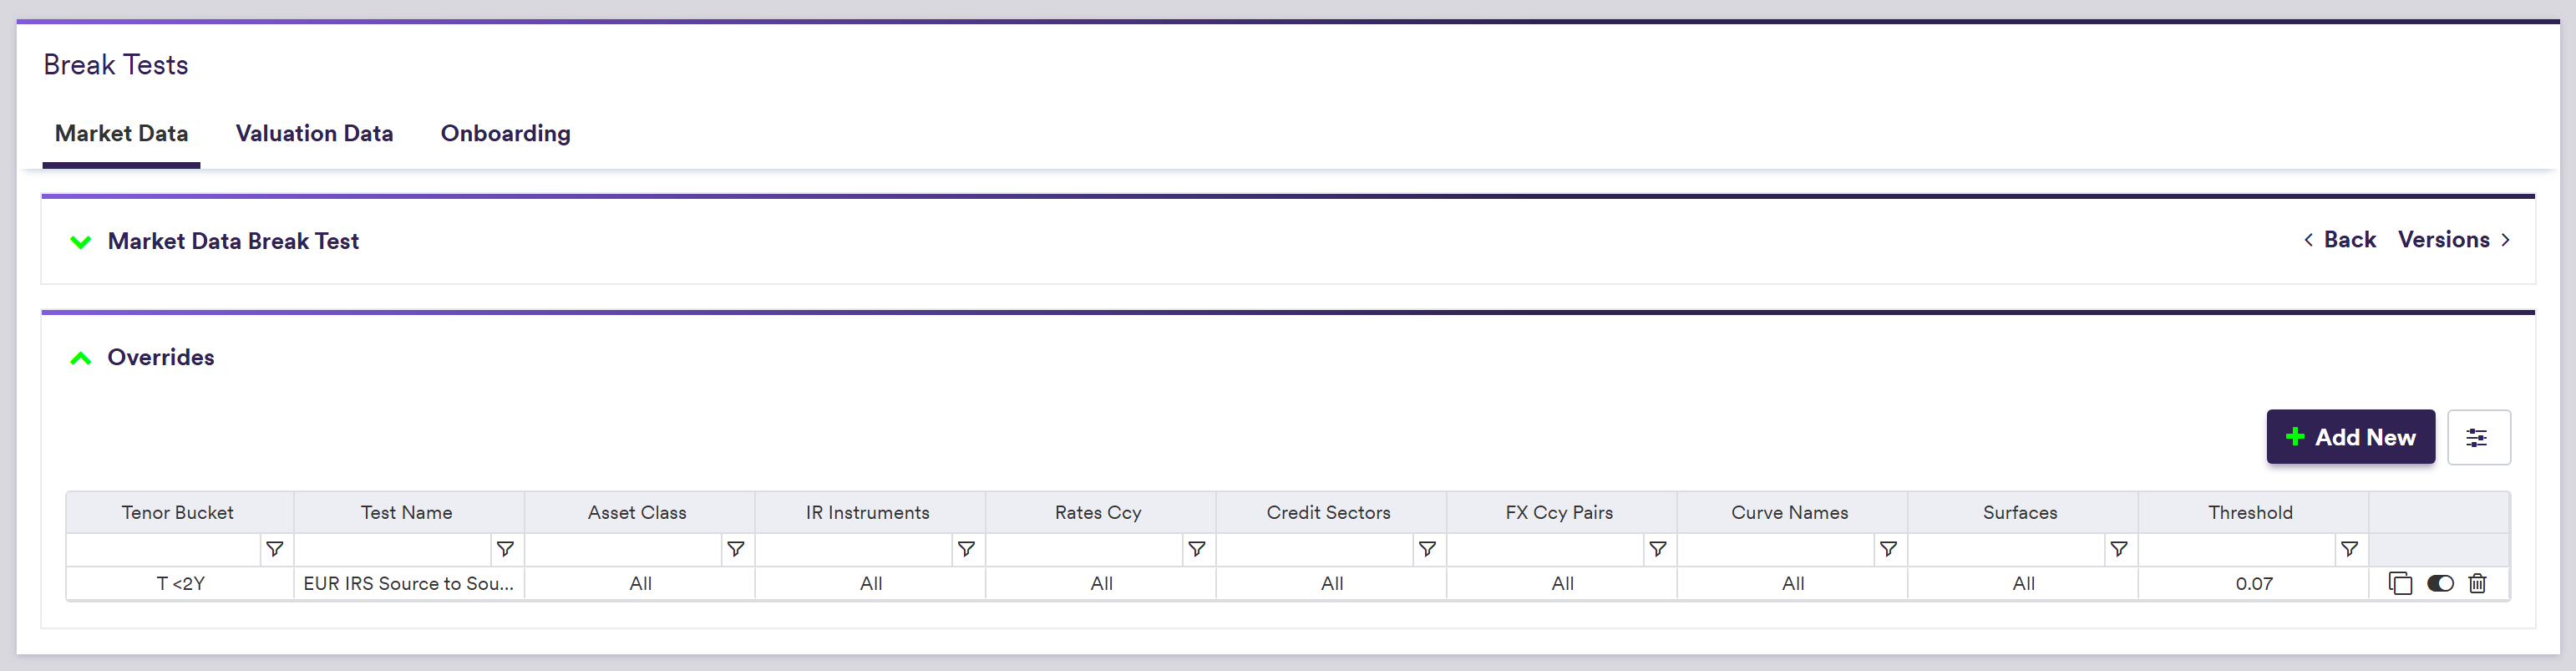
- A EUR IRS Source to Source overlay break test, which compares the market data provided by the primary and the secondary providers for EUR swap rates. It triggers a break when the relative difference is above 5%. It also contains an override for tenors shorter than 2Y, for which a more lenient threshold of 7% is applied.
The example below will guide you through re-defining the EUR IRS Source to Source test. To do so, you will have to archive it first by clicking on .
Under
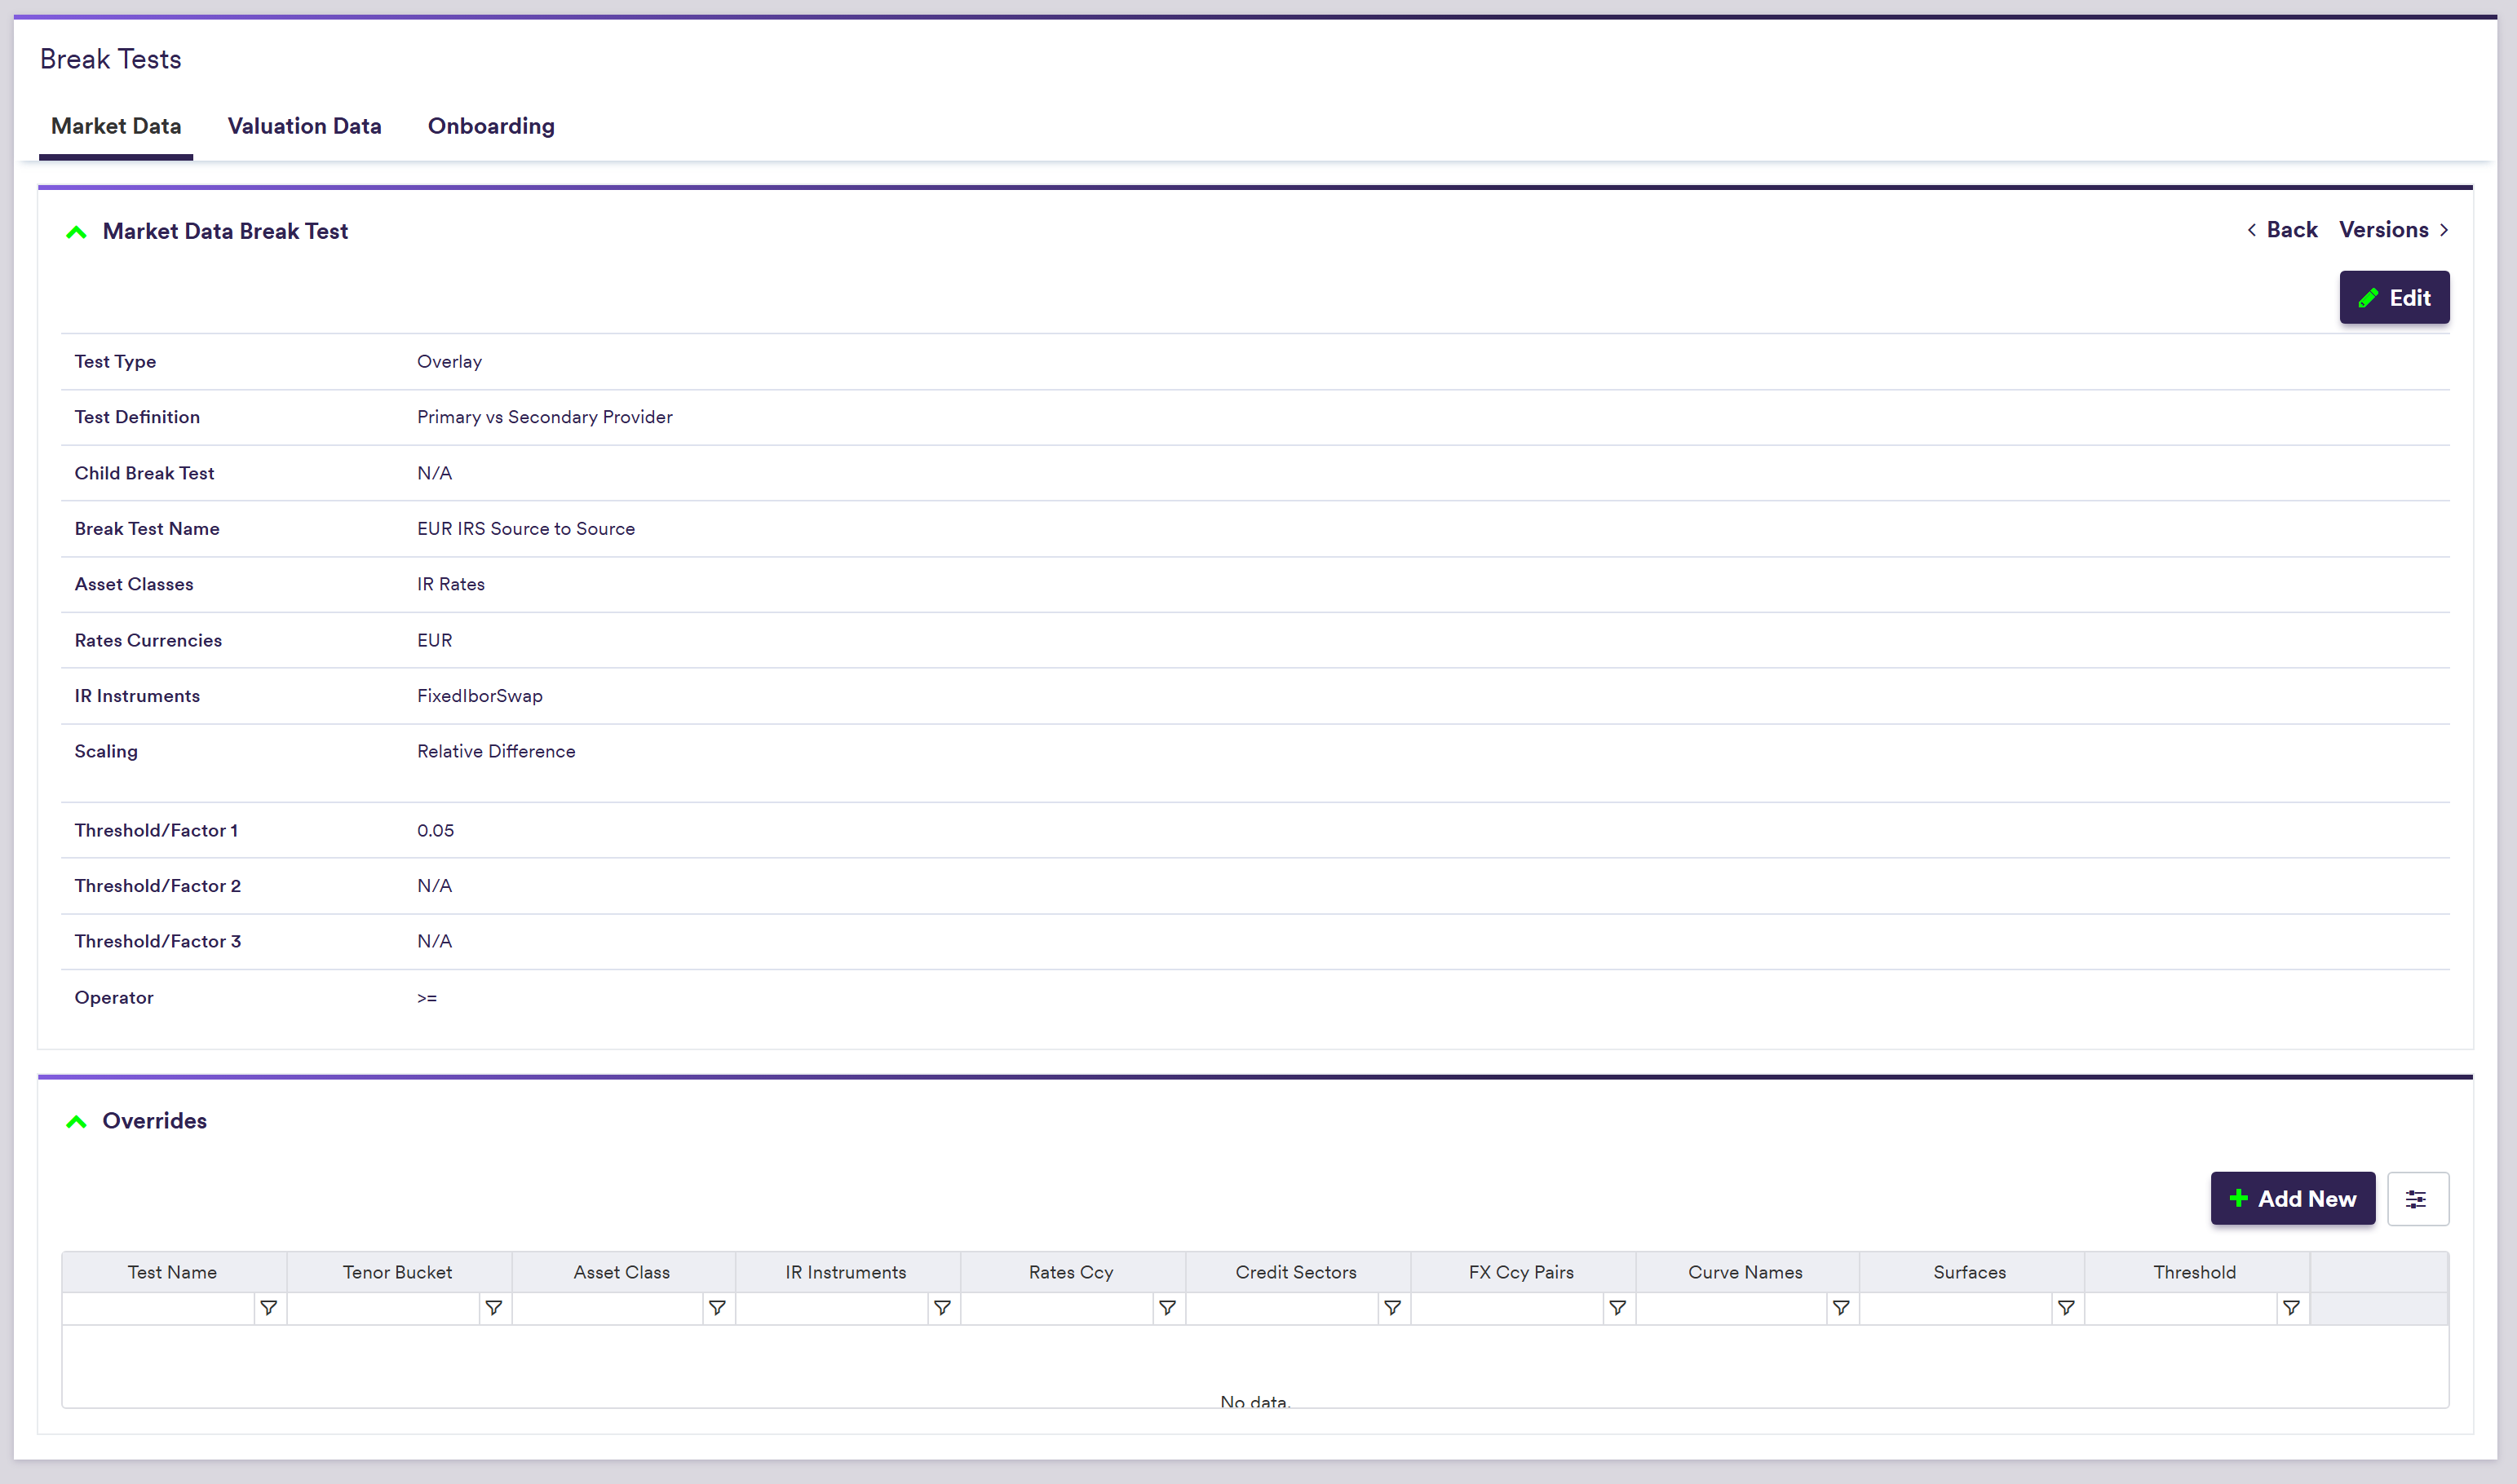
specifying the 0.07 threshold for short-term tenors
2. Break Tests for Valuation Data
Prior to running a valuation data anomaly detection process, you will first need to define the currency in which third-party valuation data is reported (i.e. trade currency or reporting currency).
Break tests for valuation data can be split into two categories which will be applied in the following order:
- Overlay I break tests, where the base value will be that of the primary provider (e.g. day-on-day)
- Overlay II break tests, where the base value will be that of the Overlay I cleaned data (e.g. source-to-source)
Overlay I break tests include a ‘NULL’ test which you cannot disable.
Overlay break tests can be defined with up to three different break thresholds (to prioritise the severity level), and the difference in data can be scaled in various ways prior to being compared (e.g. relative value, notional, NAV, DV01).
When performing valuation data break resolution and approval, the order of the break test results in the resolution / approval table will reflect the row ordering of your break test definition under
Break test definitions and applicable scalings for valuation data are described in the table below, with the following conventions:
- PV(t,i), i = 1, 2, 3 or 4 (Base, Secondary, Tertiary or Quaternary Provider) (where applicable)
- ΔPV(t,i) = P(t,i) - P(t-1,i)
- For source-to-source break tests, the waterfall to determine P(t,i) will be: Overlay I value -> raw value
- For day-on-day break tests, t-1 will be defined as the latest date (prior to the current date) on which a VD XM dashboard was run for the pricing slot and portfolio(s) in scope. P(t-1,i) will be the final verified value when such dashboard was completed.
If an overlay break test calculation can not be performed due to a missing raw valuation data value, this will not trigger a break however, the number of “skipped” tests will be reported in the dashboard (including the case when a VD XM dashboard is run for the first time and where no day-on-day break test calculation is possible, due the absence of a previous day’s verified value).
Overlay break tests will be applied to data in respect of all providers. However, they will only trigger a break in respect of the base value, unless used as a child break test (see below).
The ‘Stale’ break test can only be applied to data in respect of the primary provider (i=1), as set out in the table below.
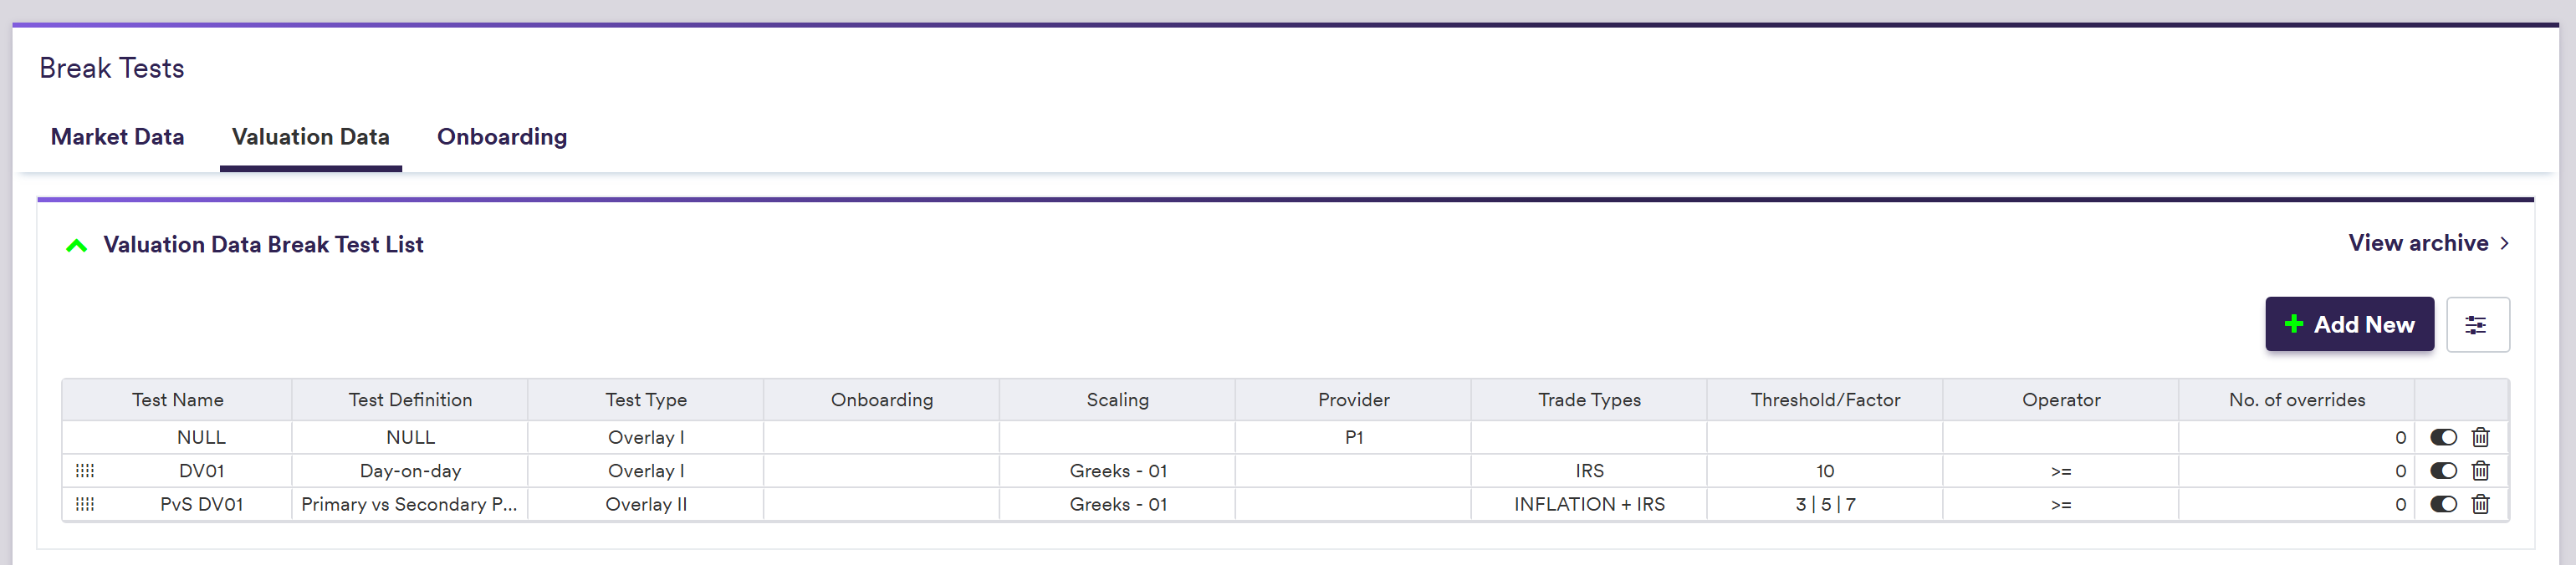
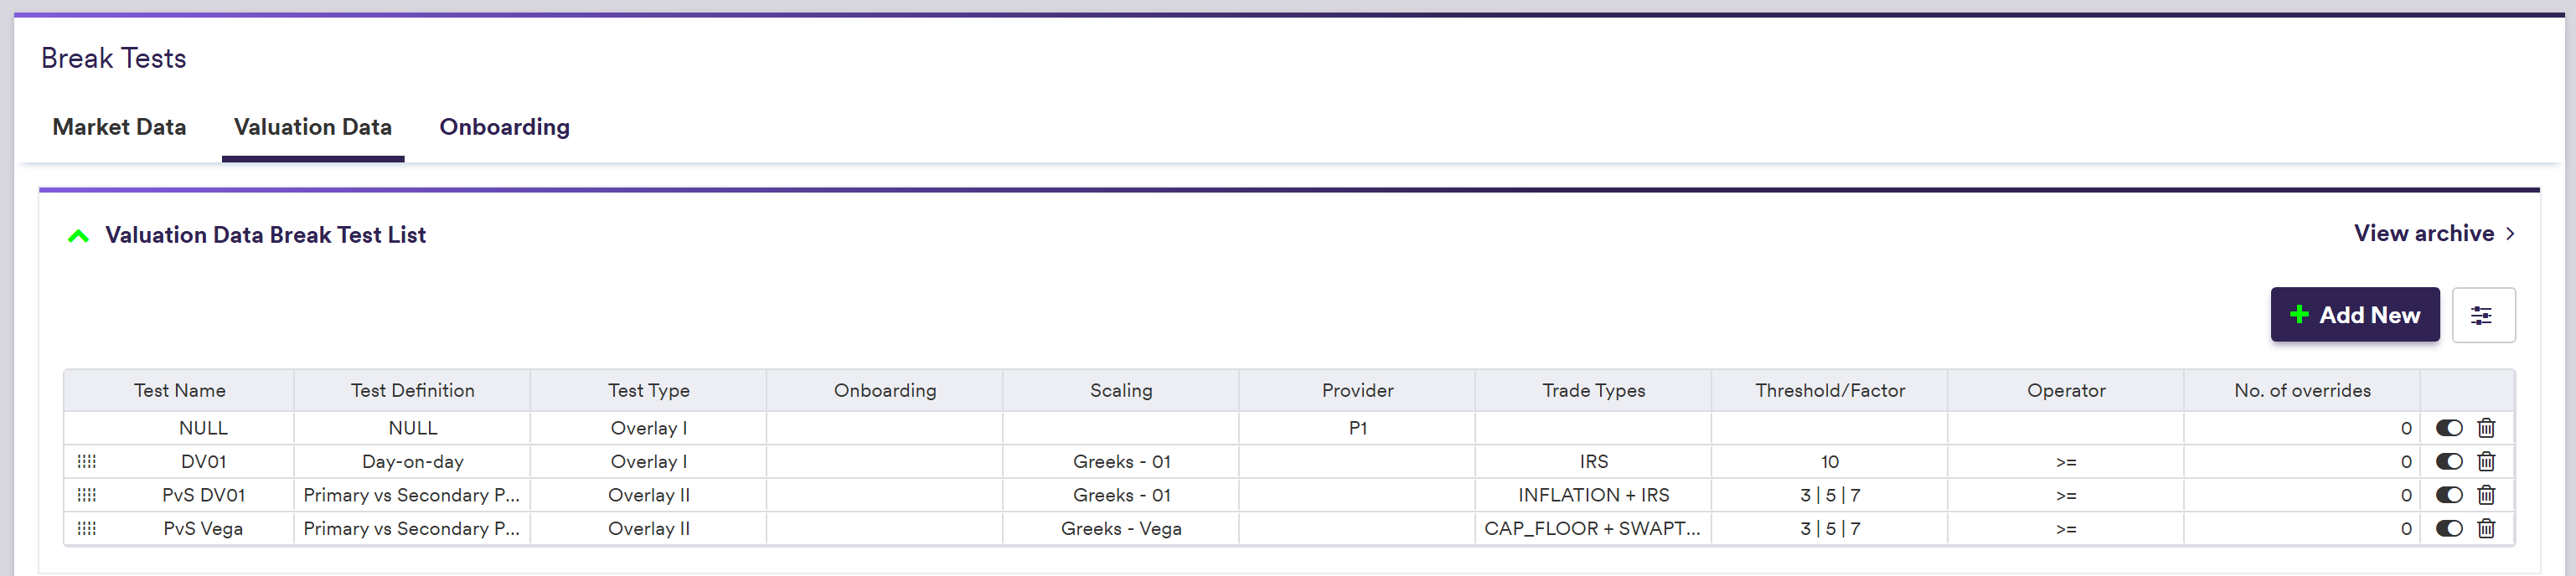
In our sandbox environment, in addition to the ‘NULL’ test that cannot be disabled, (*) we have predefined the following tests:
- a DV01 day-on-day Overlay I break test, for IRS trades, which triggers a break when the change in value is above 10 times the relevant 01 of the trade, with a 5 times override threshold for MXN rates trades (**)
- a PvS DV01 source-to-source Overlay II break test, which compares the Overlay I cleaned data to the raw valuation data provided by the secondary provider for linear trades. It triggers a break when the difference in value is above 3, 5 and 7 times the relevant 01 of the trade respectively, according to the severity level. (**)
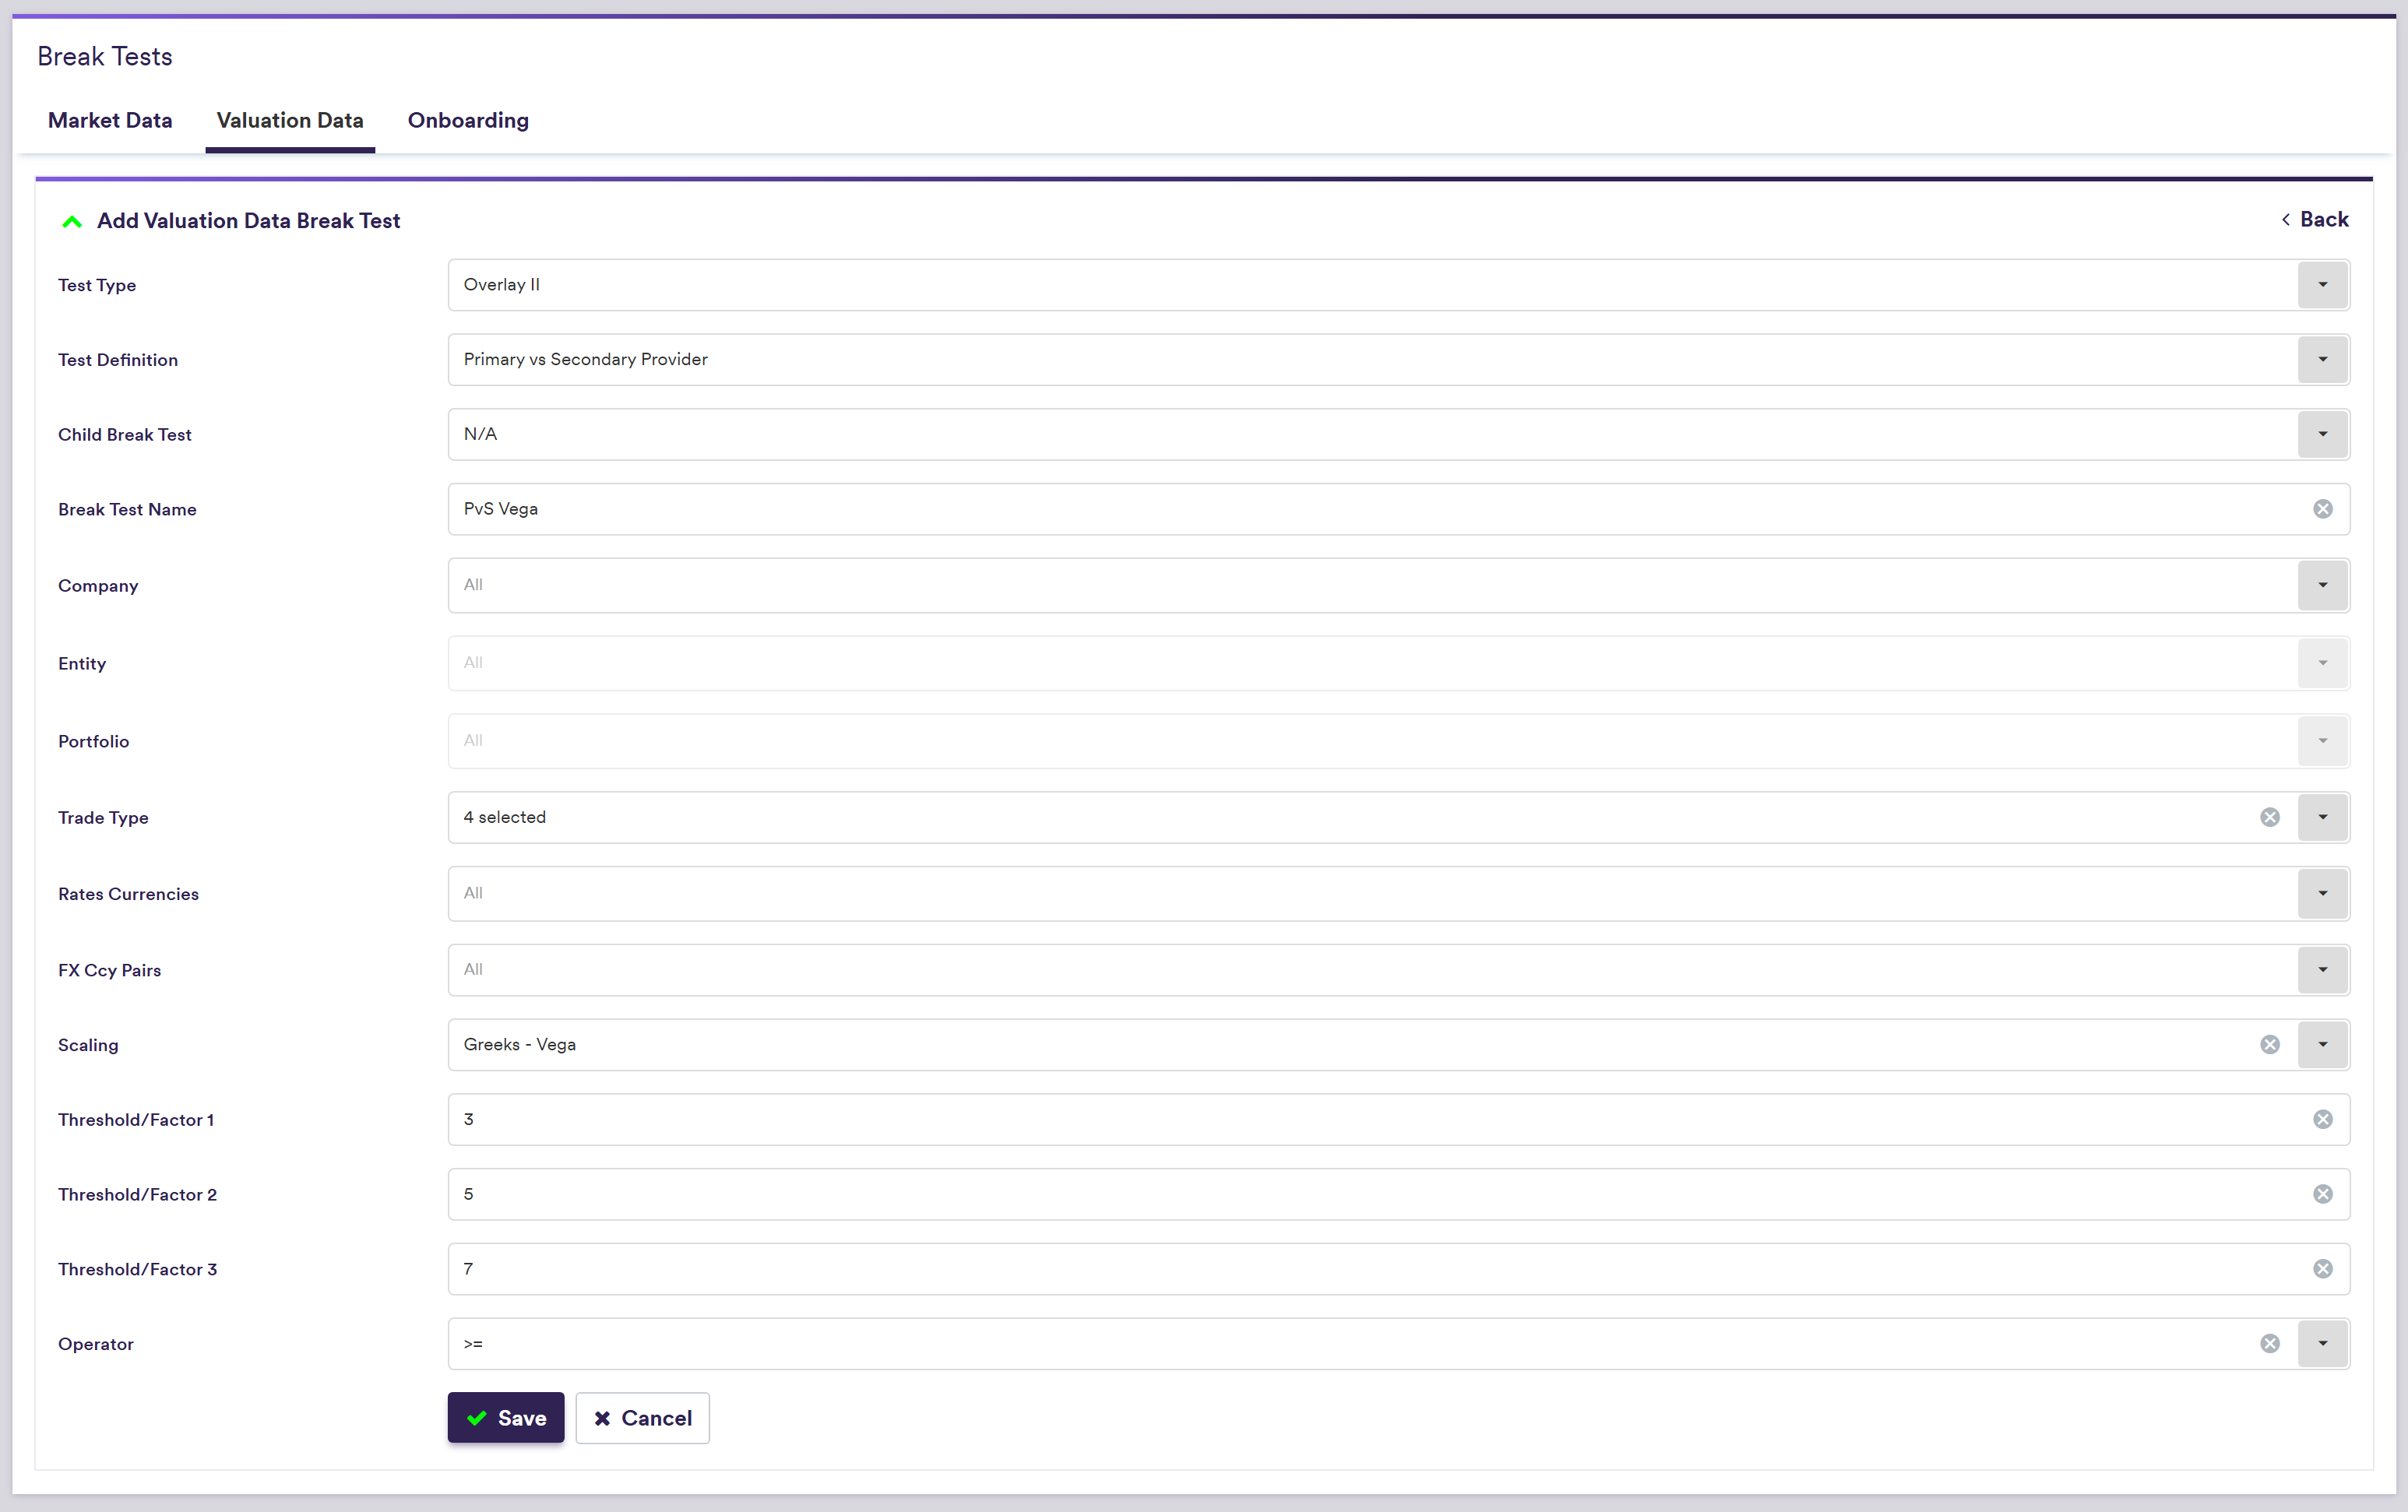
- a PvS Vega source-to-source Overlay II break test, which compares the Overlay I cleaned data to the raw valuation data provided by the secondary provider for option trades. It triggers a break when the difference in value is above 3, 5 and 7 times the vega of the trade respectively, according to the severity level.
(*) if the ‘NULL’ break toggle is ‘disabled’, the ‘NULL’ break test will still be run, but the corresponding test result column will be hidden from the display, as ‘NULL’ will be shown as the valuation data itself
(**) the relevant 01 means DV01 for rates trades, INF01 for inflation trades and CS01 for credit trades
The example below will guide you through re-defining the PvS Vega Test test. To do so, you will have to archive it first by clicking on .
Under
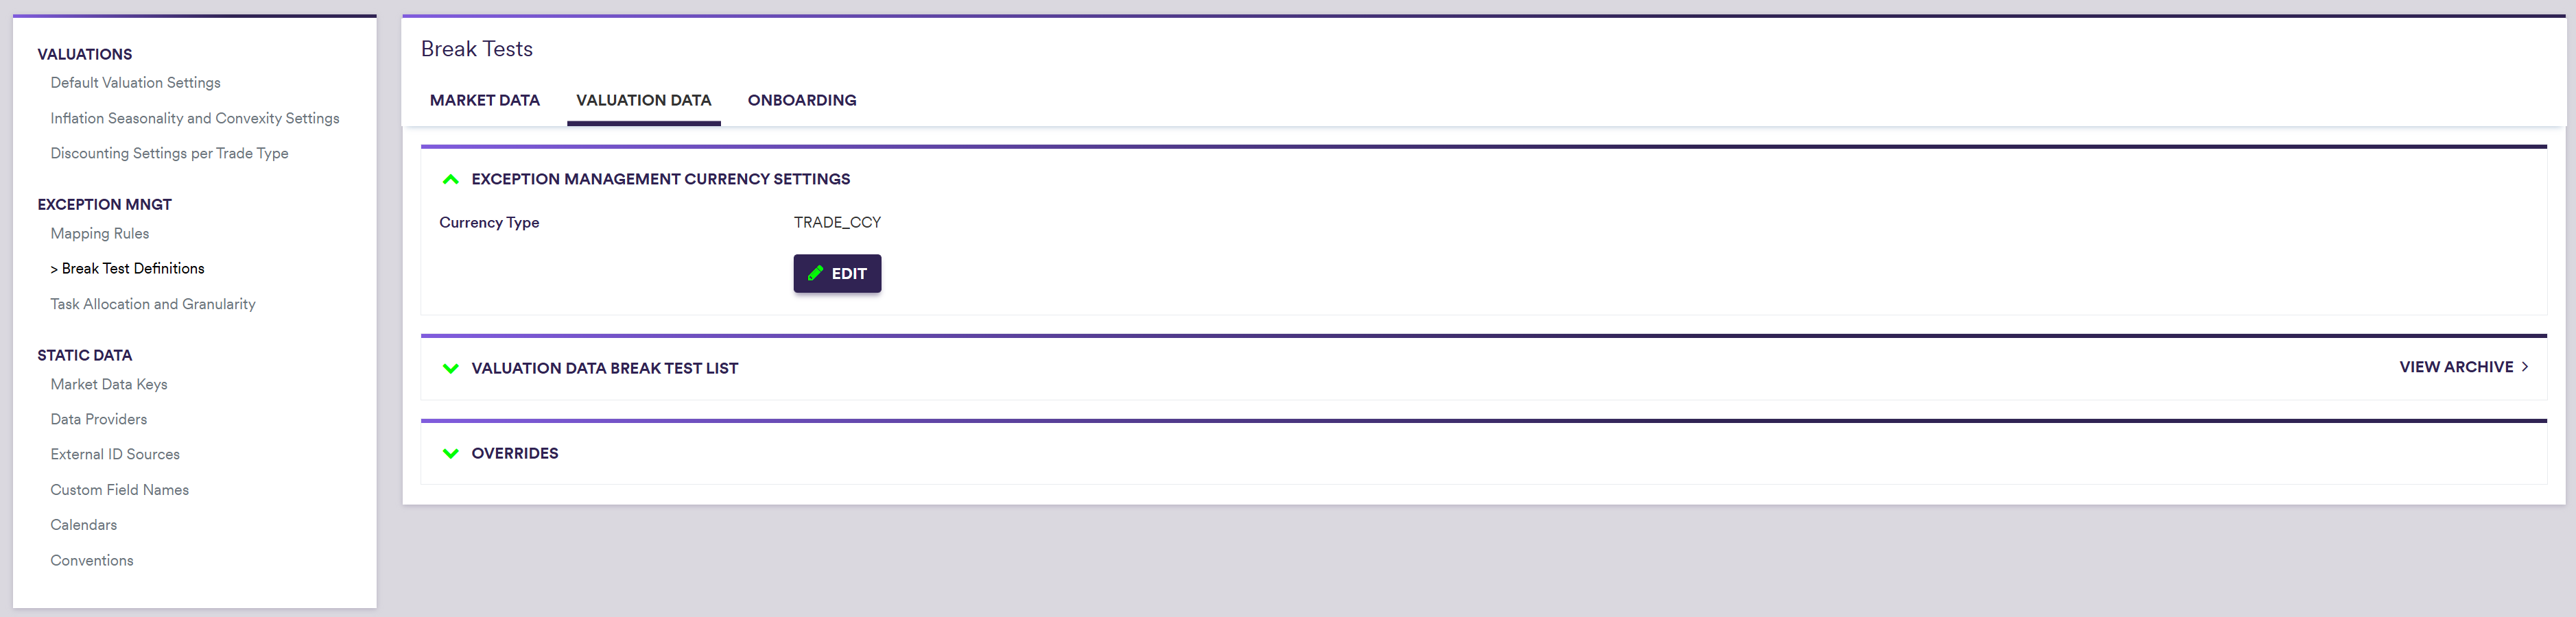
Exception Management Currency Settings
Prior to running a valuation data anomaly detection process, you will first need to define the currency in which third-party valuation data is reported (i.e. trade currency or reporting currency). This is relevant in particular when Xplain is one of your valuation data providers, to ensure that the correct valuation calculated in Xplain is used during the exception management workflow.
Under
A description of the attributes and corresponding permissible values for exception management currency settings are set out in the table below.