In order to perform valuations in Xplain, you first need to ensure you have curves ready to be calibrated. You can use the pre-configured Xplain Default Curve or create your own.
This page will take you through the steps to build a curve group independently.
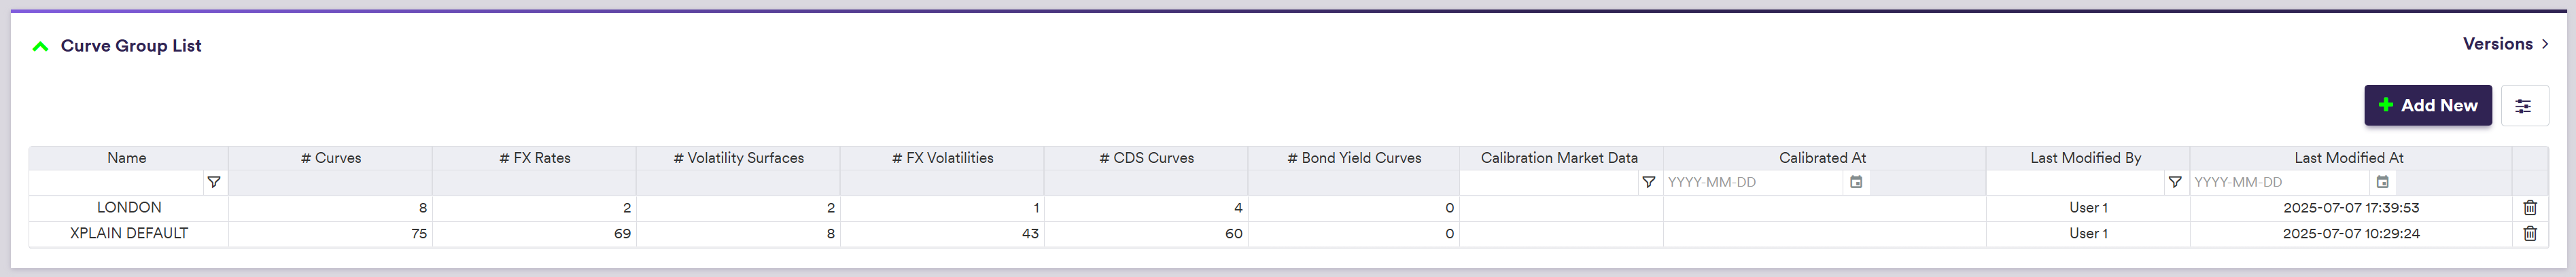
1. Creating a Curve Group
Under
For this example, you will import setup data to replicate the LONDON curve configuration and LONDONFICC company setup. You can download the _CSV data files here.

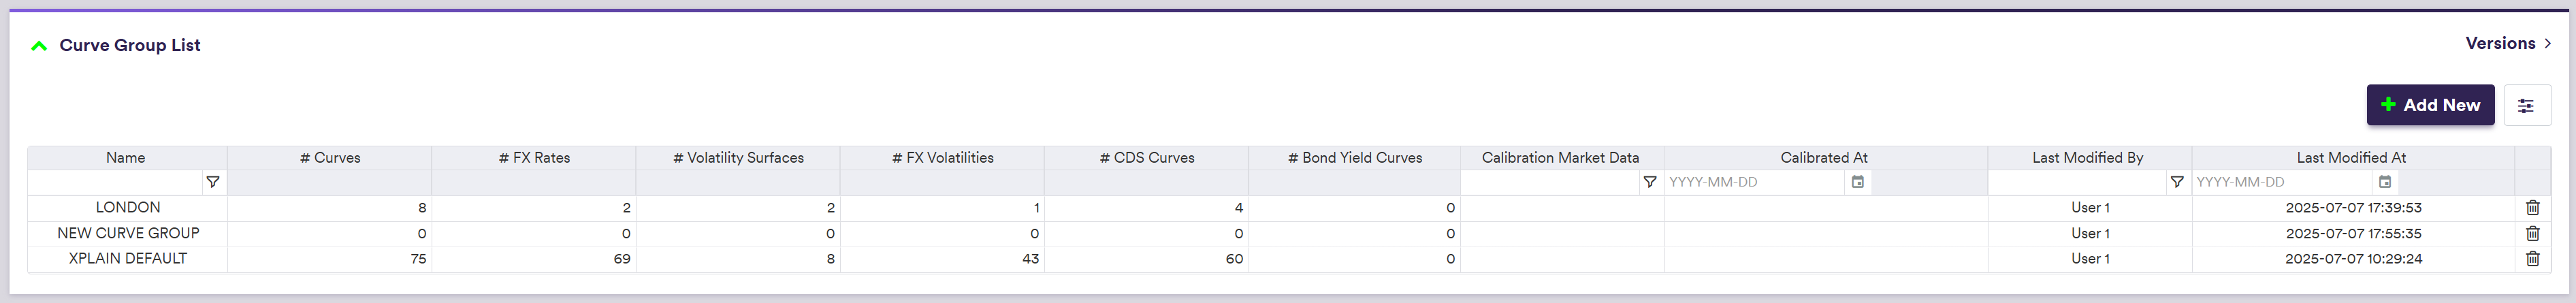
Once you have created the curve group, it can now be defined by a list of:
- IR + INFLATION curves (IR_INDEX, TENOR_BASIS, XCCY)
- FX RATES
- IR VOLATILITY surfaces
- FX VOLATILITY surfaces
- CREDIT curves
- BOND YIELD curves
For more details, please refer to the relevant section.