Under
- run the XVA calculation process (and exposures, if applicable)
- save, slice and dice PV and XVA calculation results
- compare saved PV calculation results for a given portfolio (e.g. day-on-day or using different valuation settings) (see Valuations)
Running XVA Calculations
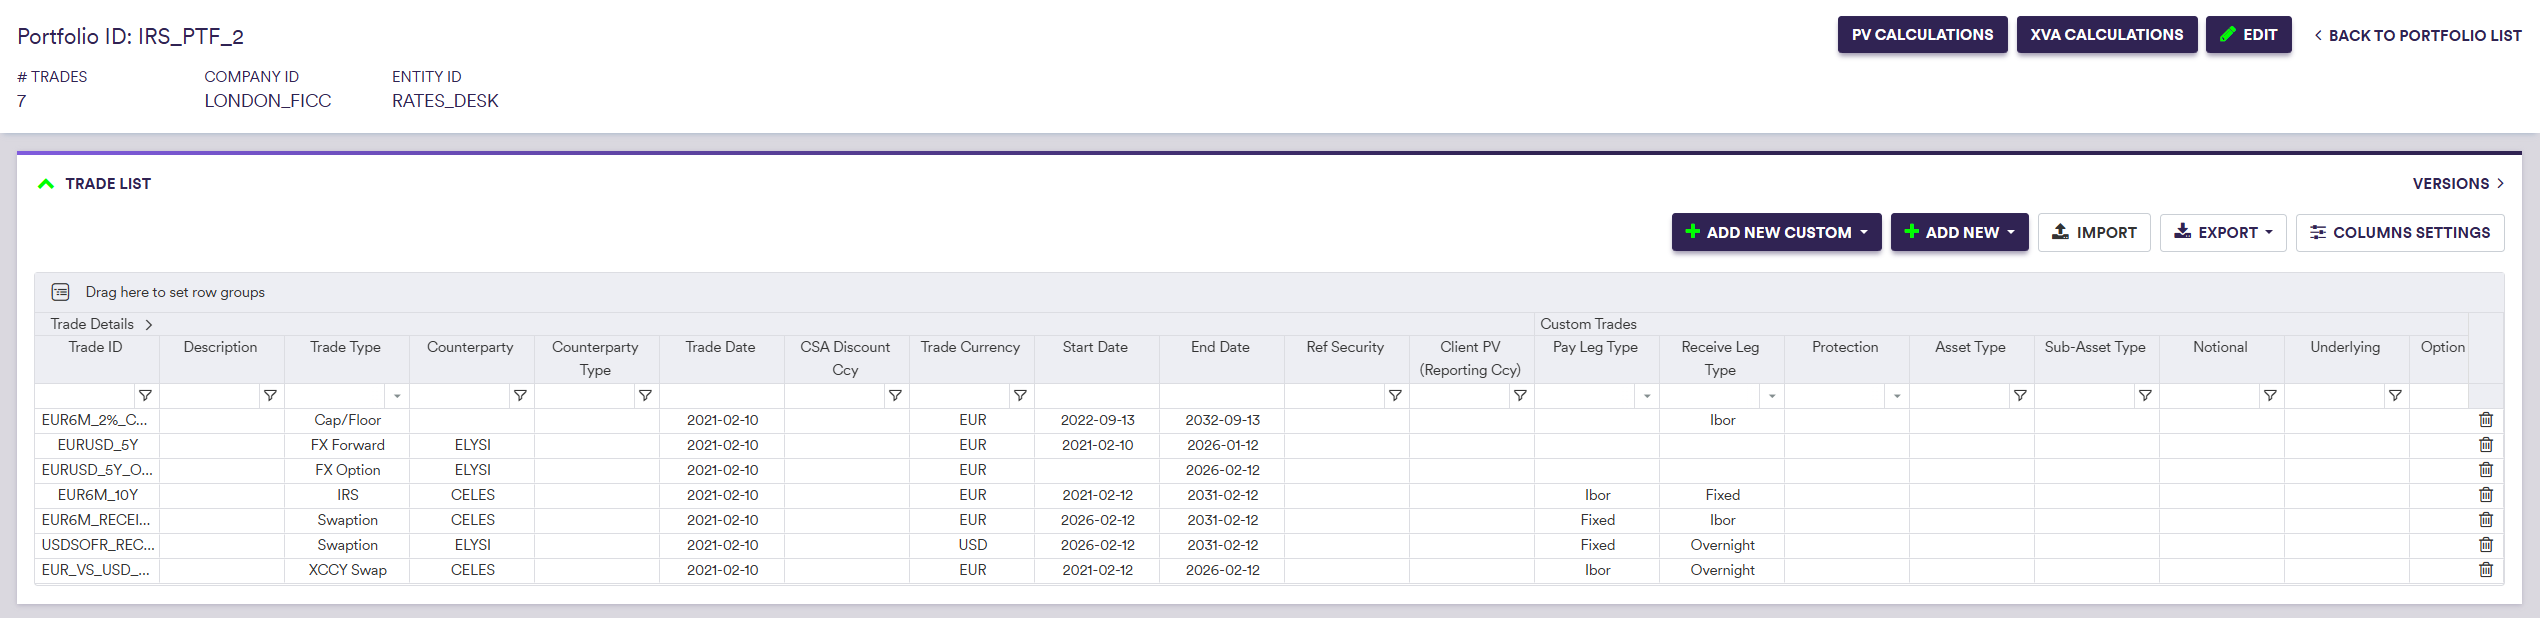
Once you have added relevant funding nodes, defined a curve configuration, a market data environment, a portfolio, the applicable valuation settings and the XVA model parametrisation, the XVA calculation interface can be accessed i) at the portfolio level under
Prior to valuing a portfolio and performing XVA calculations, you will need to:
- set the valuation parameters (see Valuations)
- apply curve shifts, if any (see Valuations)
- set the XVA calculation parameters
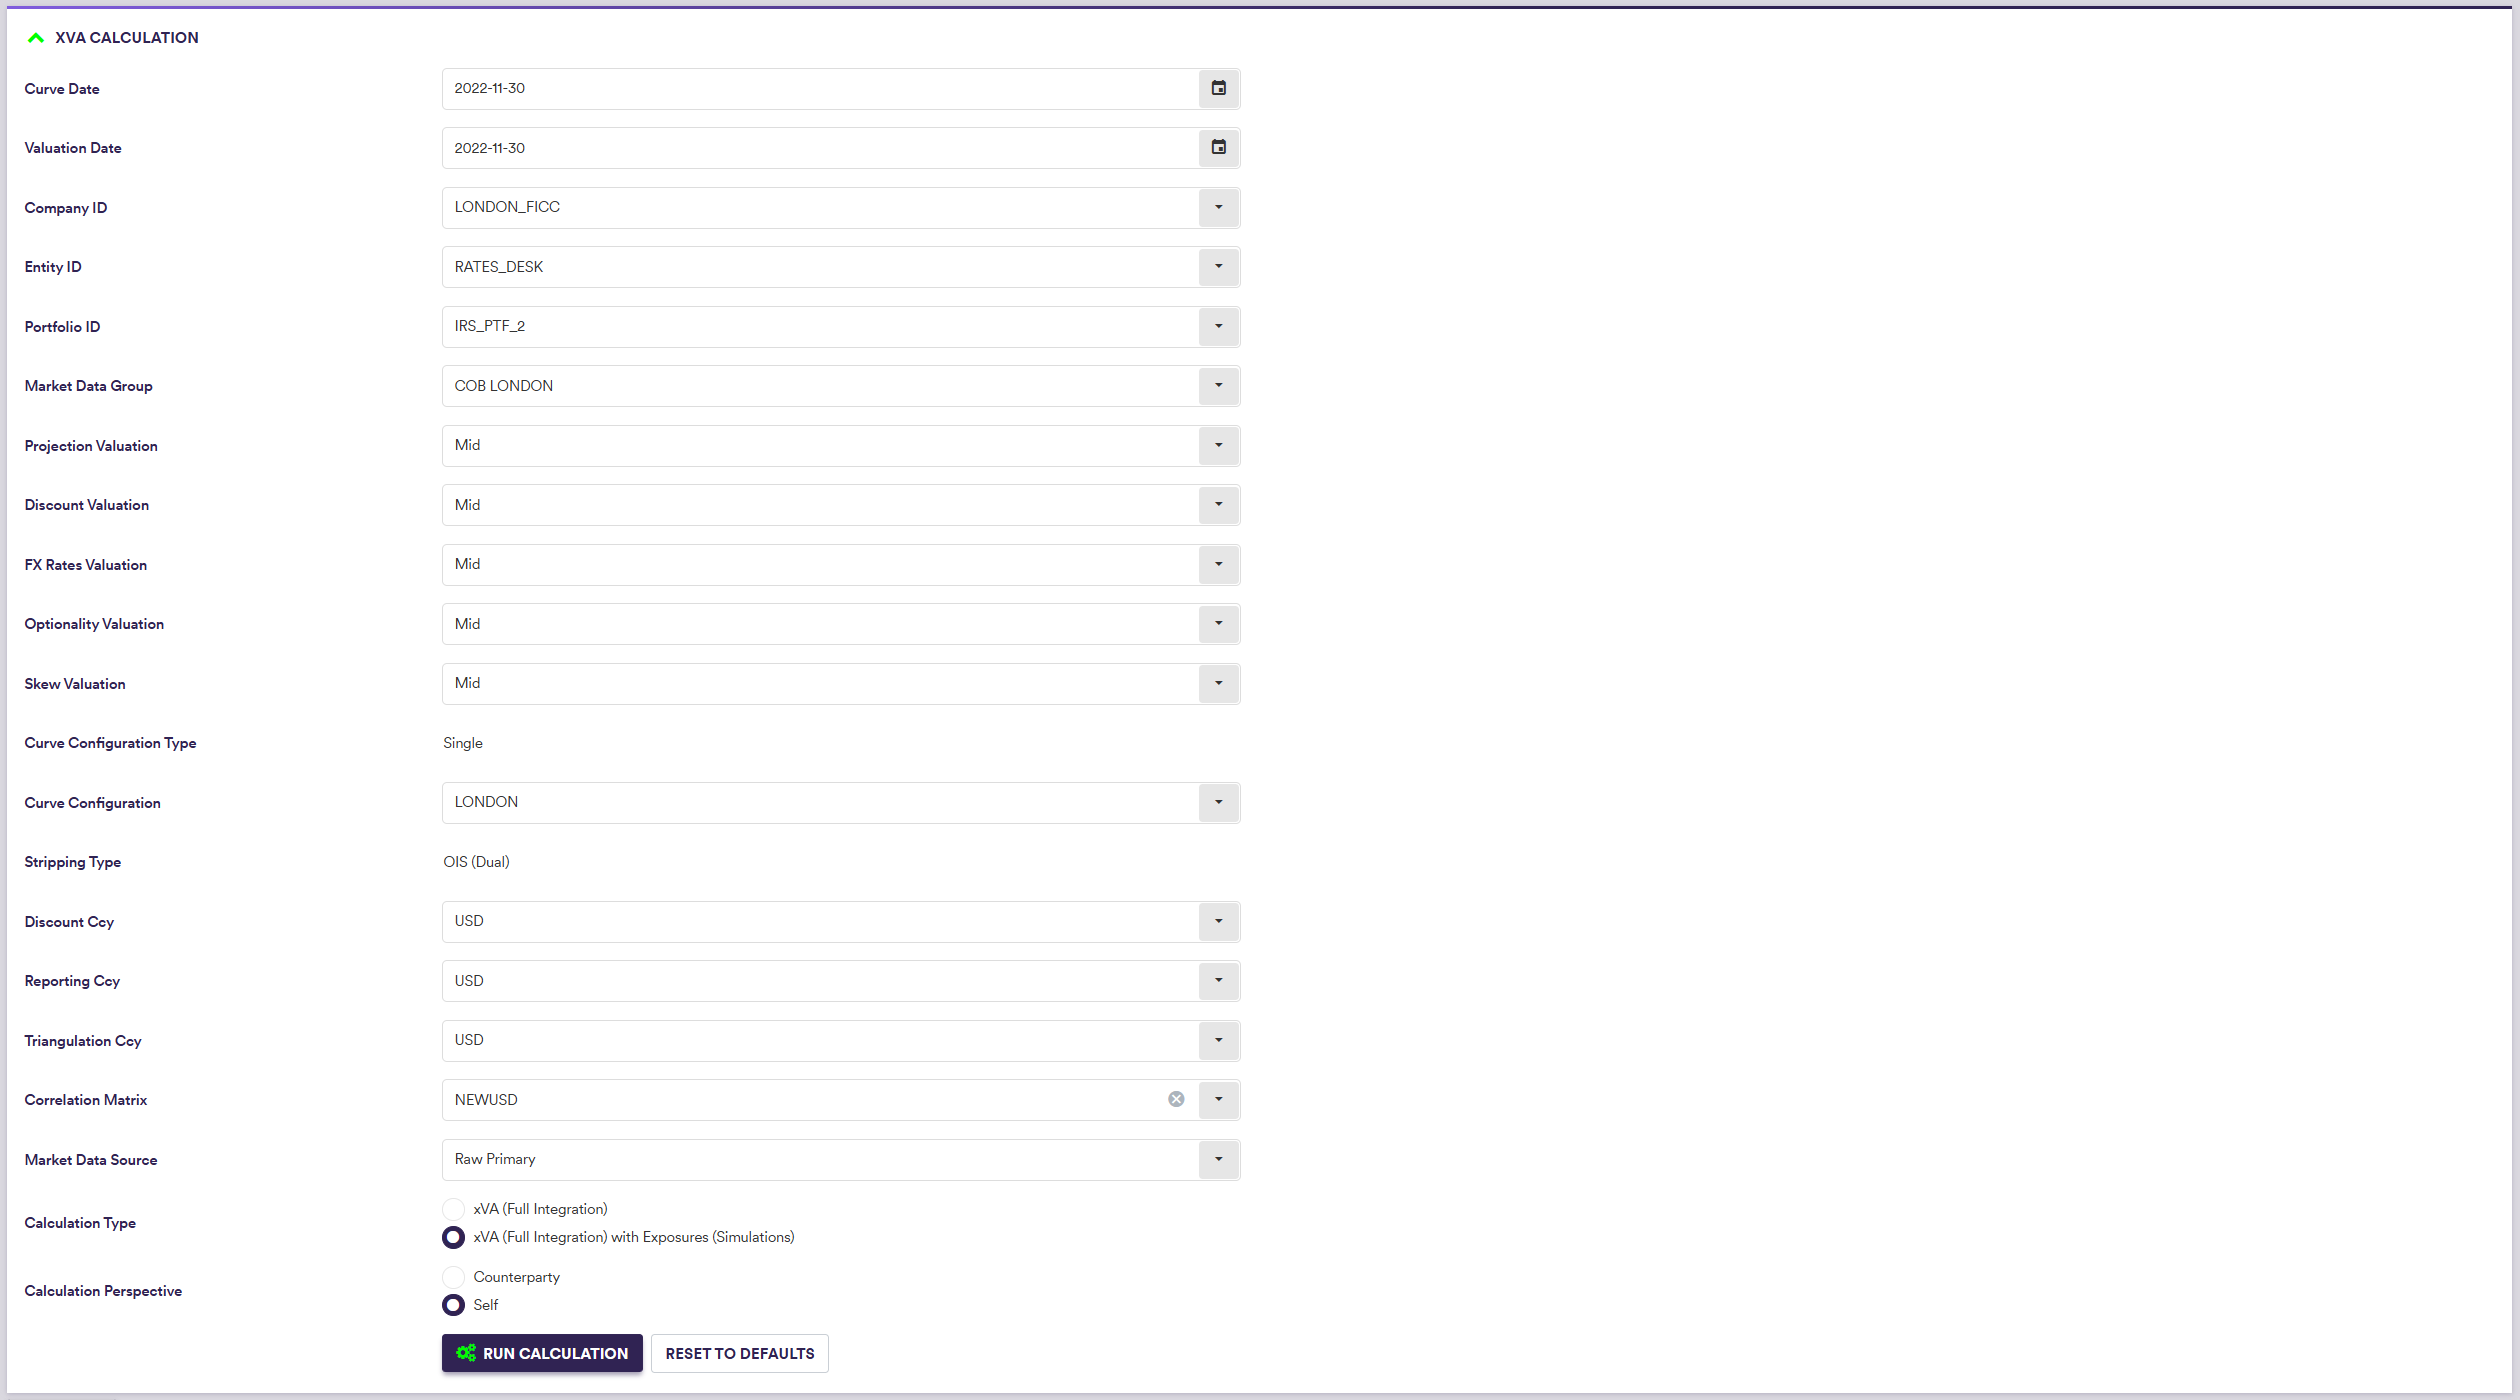
A description of the settings specific to XVA calculations and corresponding permissible values are set out in the table below.
XVA Calculation Results
Once a portfolio (and XVA) has been valued (after clicking on

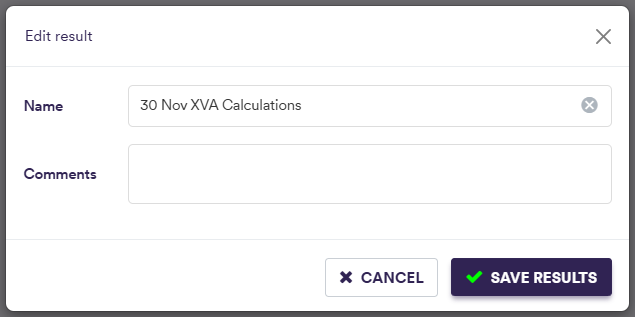
You can save the selected XVA calculation results by clicking on

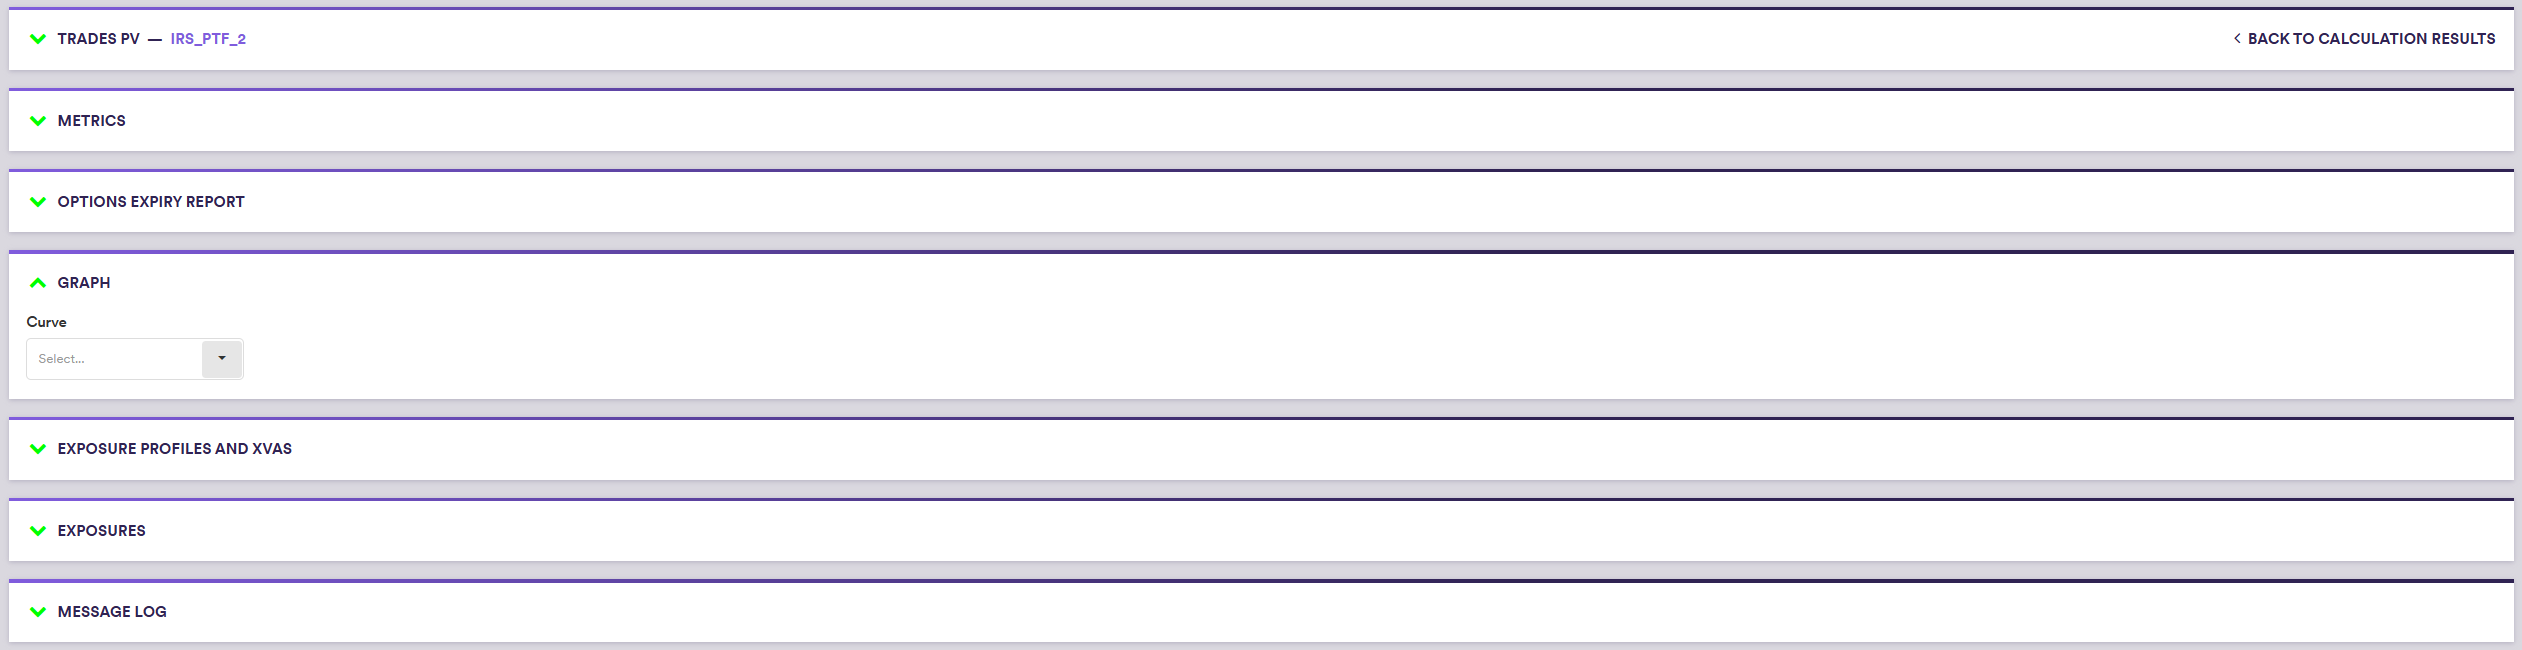
At the XVA calculation results level (by double-clicking on the line item), the various valuation outputs are:
- trade PV, T0 cashflows and greeks on a trade basis (see Valuations)
- portfolio metrics (cashflows and bucketed greeks) (see Valuations)
- option expiry heatmaps (swaptions and FX options) (see Valuations)
- graphs of calibrated curves used in the valuation process (see Valuations)
- message log of events that were recorded during the valuation process (see Valuations)
In addition, the XVA calculations outputs are:
- XVA calculations and corresponding exposure profiles (if applicable) on a counerparty basis
- underlying exposure simulation results
After saving, XVA valuation results will also be accessible on a trade level in the trade valuation history screen (see Trade Valuation History).
1. XVA Calculation Results on a Counterparty Basis
In the “EXPOSURE PROFILES AND XVAS PV” window, you can view, filter and export XVA calculation results on a counterparty basis.
If the XVA calculations have been performed to include exposure simulations, EPE, ENE, PFE and EE per counterparty will be plotted on the right handside.
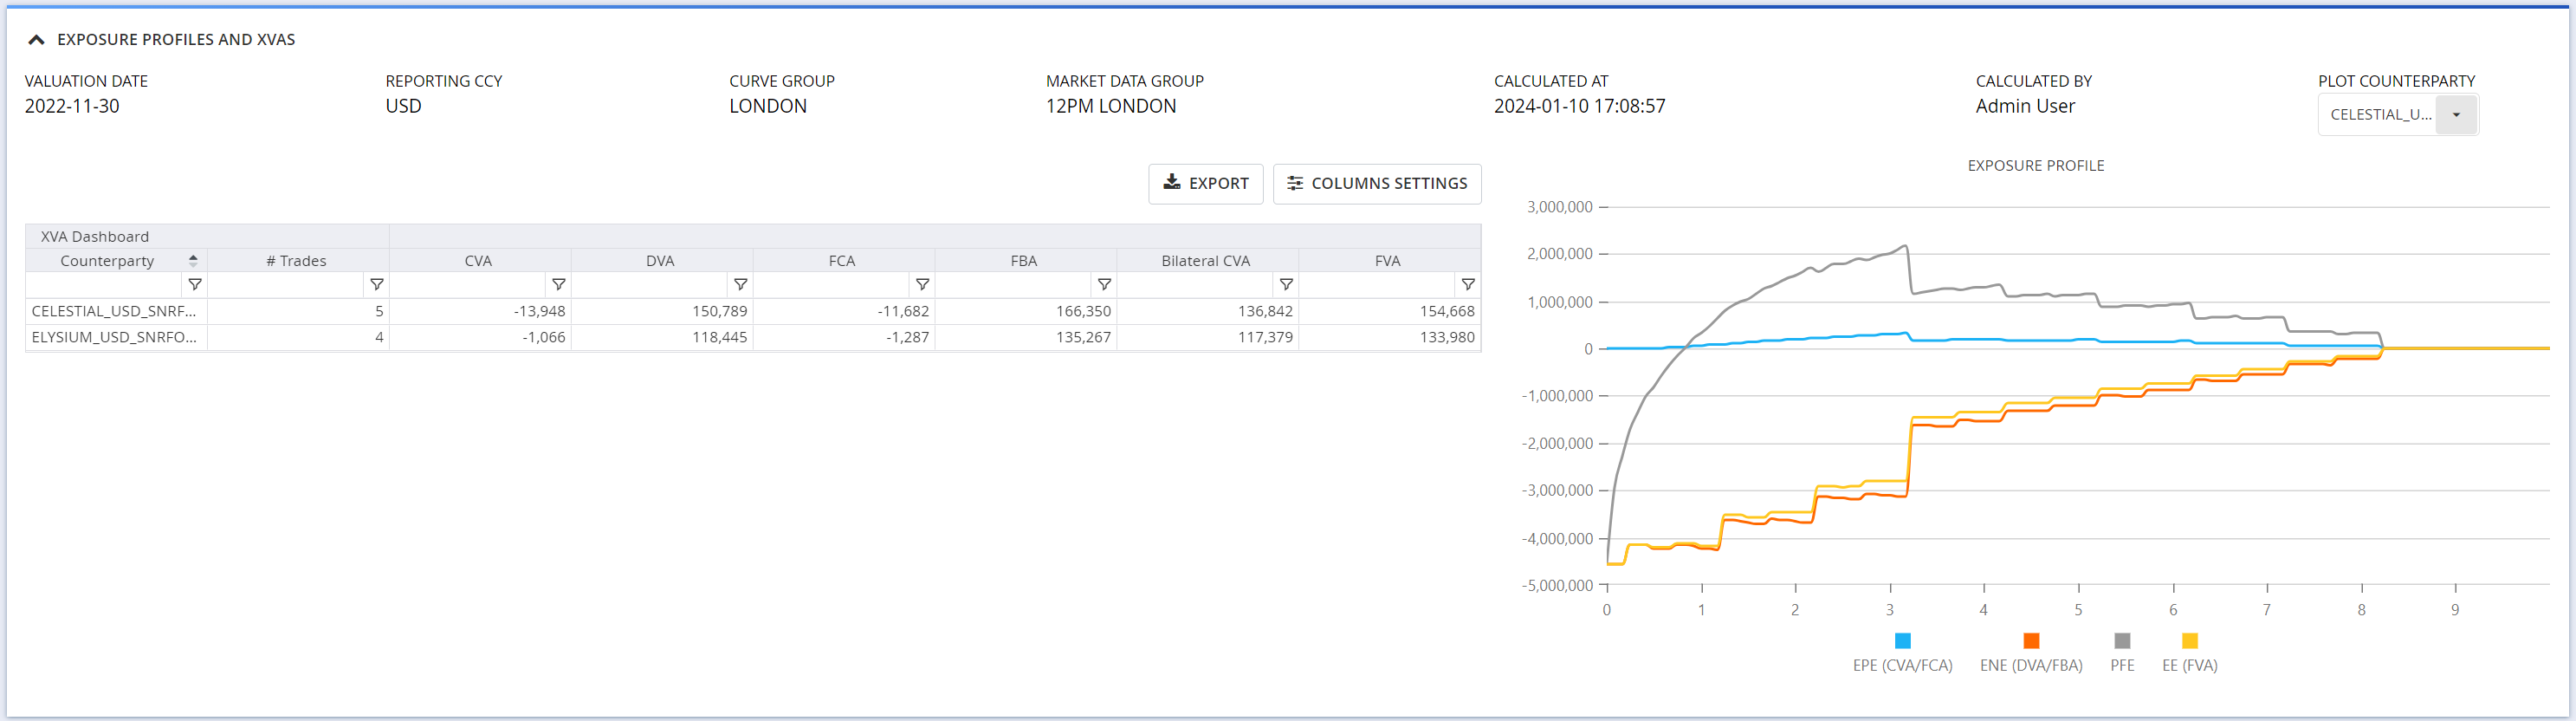
A description of the XVA calculation result outputs is set out in the table below.
2. Exposure Simulation Results
In the “EXPOSURES” window, when applicable, you can see and export exposure simulation results on a counterparty basis.
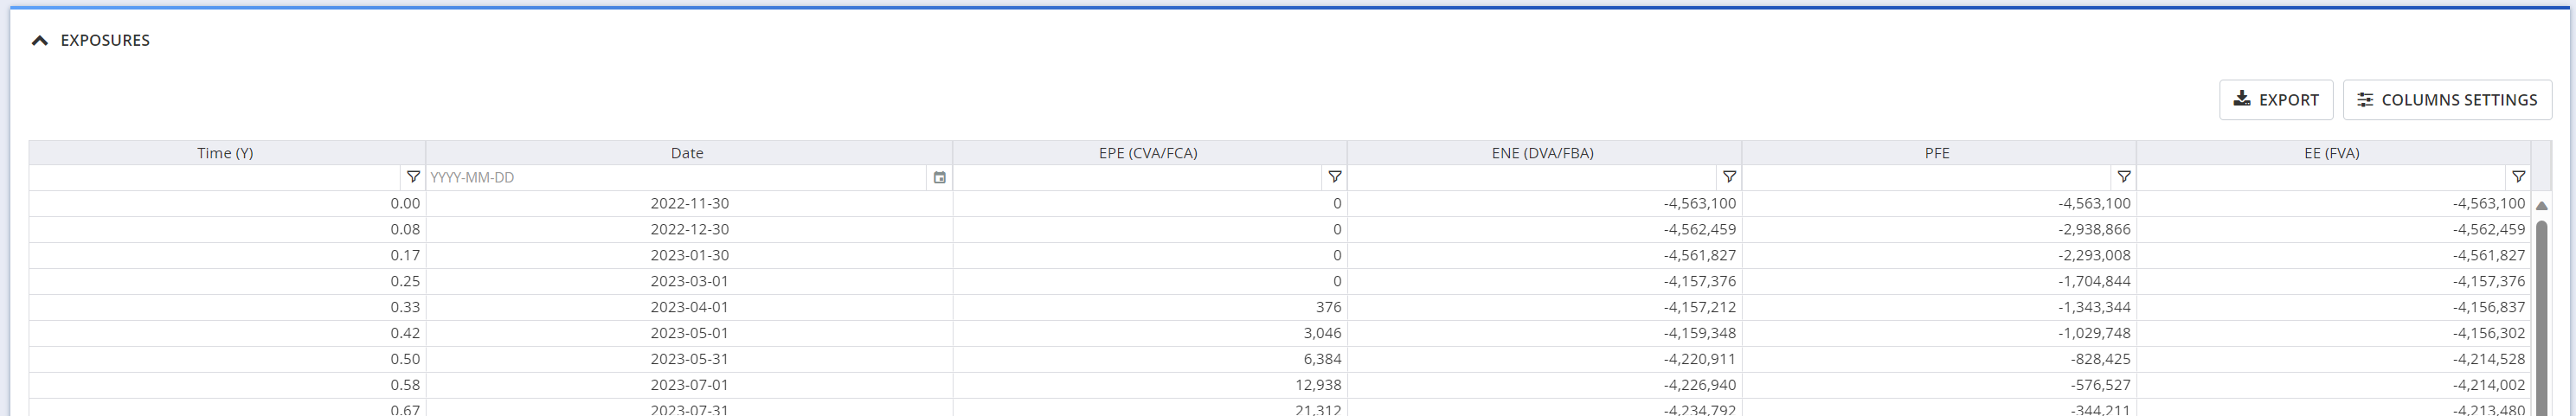
A description of the simulation result outputs is set out in the table below.